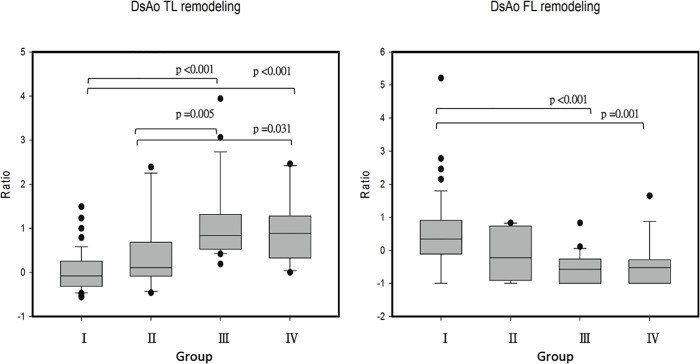
Fig 1. Volumetric change ratio of true (DsAo TL) and false (DsAo FL) lumen of descending aortic segment at one-year postoperative in four surgical groups.
Box plots show median and interquartile ranges of remodeling ratios. Group I: proximal aortic replacement (PAR) only; Group II: concomitant total arch replacement (TAR); Group III: concomitant TAR extending with stent graft; Group IV: PAR with descending aorta stent grafting.

