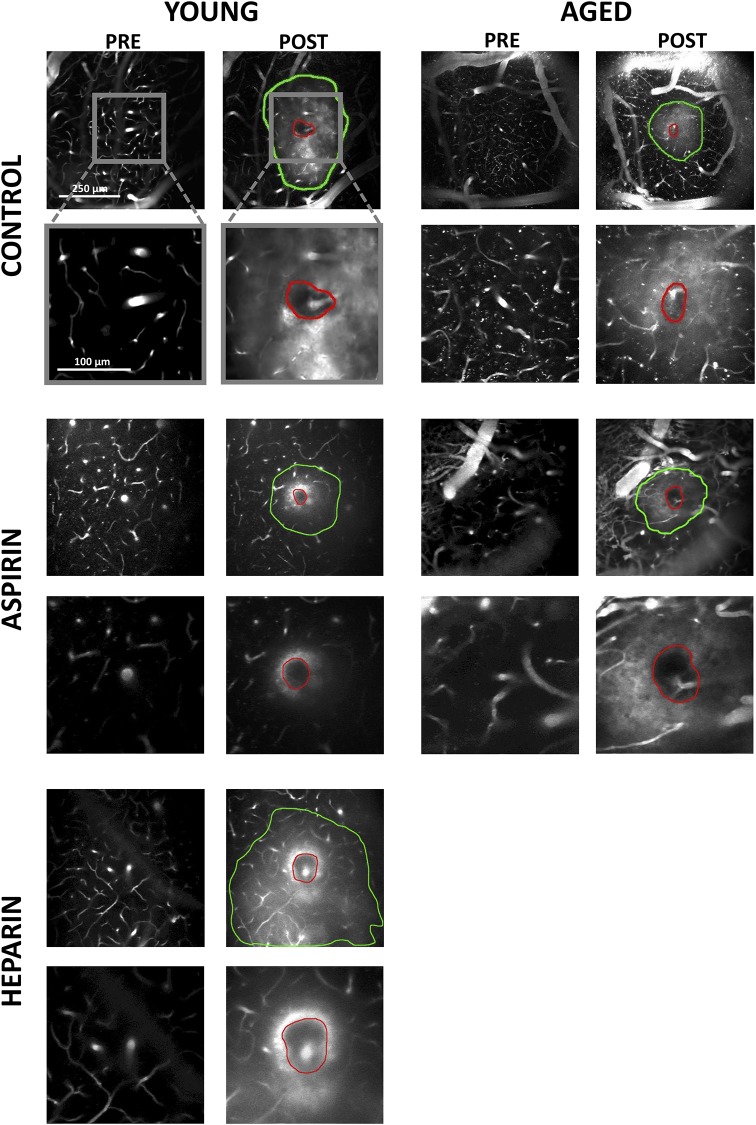
Fig 3. Hematoma core and plasma penetration after microhemorrhage.
Average projections of 2PEF image stacks showing examples of pre- and post-hemorrhage images in young and old mice dosed on aspirin or controls and young mice treated with heparin. The red outlines indicate the borders of the RBC-filled hematoma core while the green outlines depict the extent of penetration of fluorescently labeled blood plasma.

