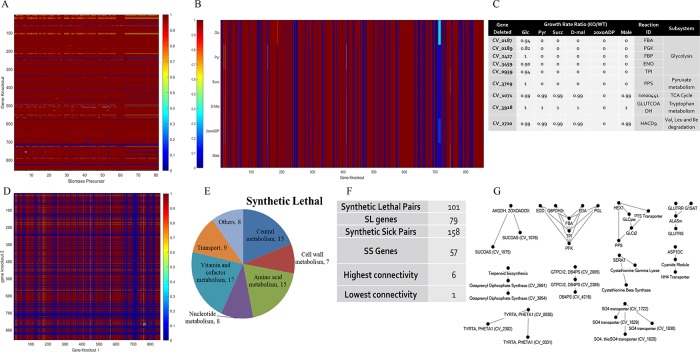
Fig 5. Gene deletion analysis.
(A) Heat map for single gene deletion (SGD) analysis for biomass precursors. (B) Heat map and table (C) for SGD analysis for 5 candidate metabolites along with glucose. (D) Heat map for double gene deletion (DGD) analysis on glucose under aerobic condition. (E and F) Unique genes involved in synthetic lethal pair interaction during DGD analysis. (G) Synthetic lethal pair interactions for two or more connectivity, highest connectivity observed in case of upper glycolysis and Entner Duordoff pathway.

