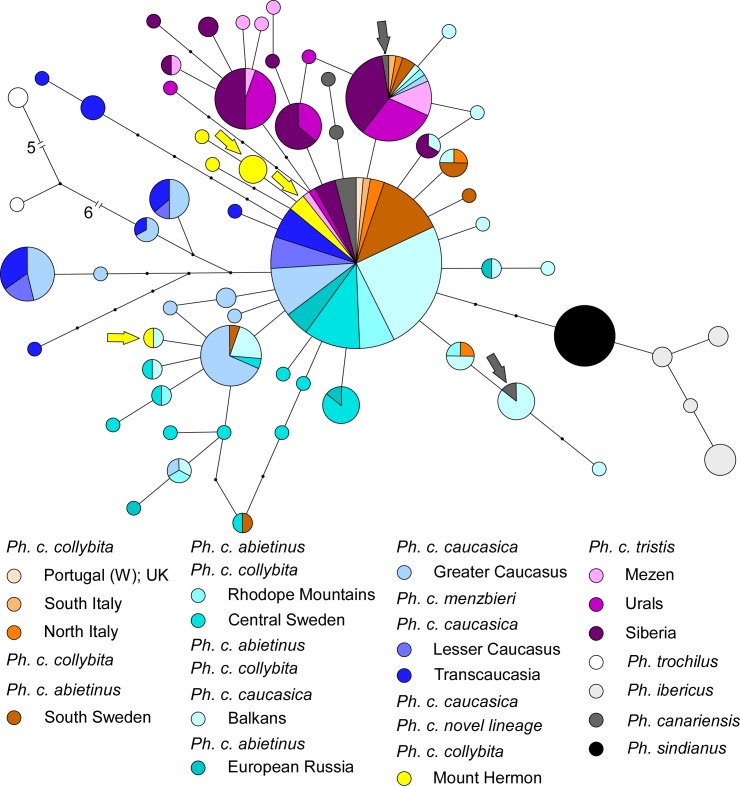
Fig 4. Network of ACO1I9 alleles.
Each circle represents an ACO1I9 allele. Circle area is proportional to the number of individual sequences obtained that corresponded to that allele. Colors represent sampling location (not necessarily ND2 clade assignment). In the localities with mtDNA clades representing multiple subspecies, the dominant one is listed first. Sectors within circles are sized proportionate to number of sequences obtained from birds at each sampling location with that allele. Grey arrows represent the ACO1I9 alleles of the bird sampled at La Palma (Canary Islands) that had a P. c. collybita ND2 haplotype. Yellow arrows indicate ACO1I9 alleles obtained from Mt. Hermon birds with the novel unassigned ND2 haplotype. Allele sharing between birds of different species or subspecies may be due to introgression or retention of ancestral shared sequences.

