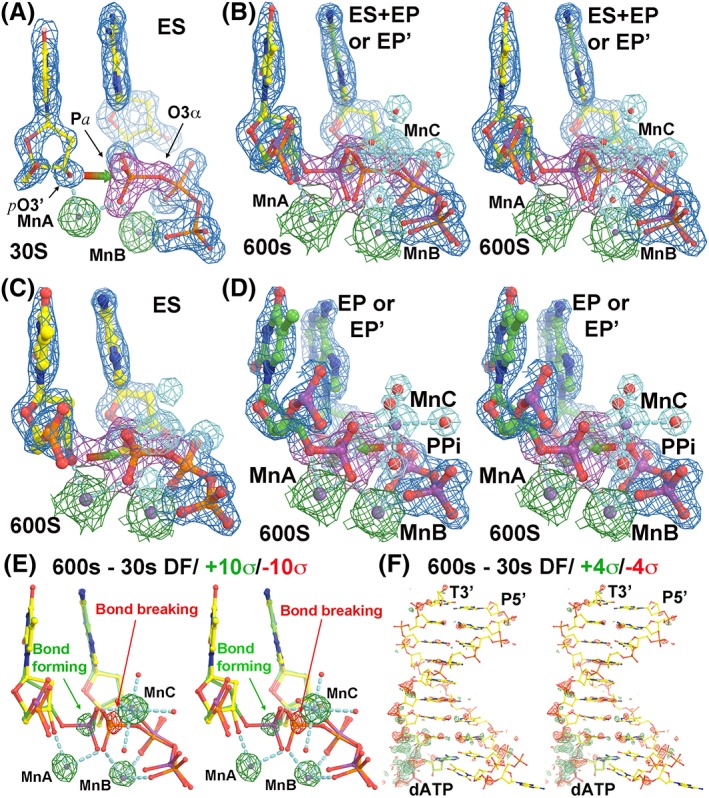
Figure 1.

The structures of human pol η replication complexes. (a) The enzyme–substrate (ES) complex at 30s. Red‐green arrow shows the direction of nucleophilic attack by primer‐terminus O3’ (ptO3’) to α‐phosphorus atom of incoming dATP. MnC does not bind in the ES complex. (b) Stereodiagram of a mixture of the ES complex with the enzyme‐product (EP or EP’) complex at 600s. (c) The ES complex at 600s. (d) Stereodiagram of the EP or EP’ complex at 600s. Red‐green arrow shows the direction of pyrophosphorolysis. The σA‐weighted 2Fobs–Fcalc maps in panels (a–d) are contoured at 2σ, but shapes of atomic ED functions of MgA and MgB are quite different at this same contouring level. (e, f) Stereodiagrams of Fobs(600s)–Fobs(30s) difference Fourier maps contoured at ±10σ (green and red) and ± 4σ for the catalytic site (e) and for the entire DNA duplex (f).
