Figure 2.

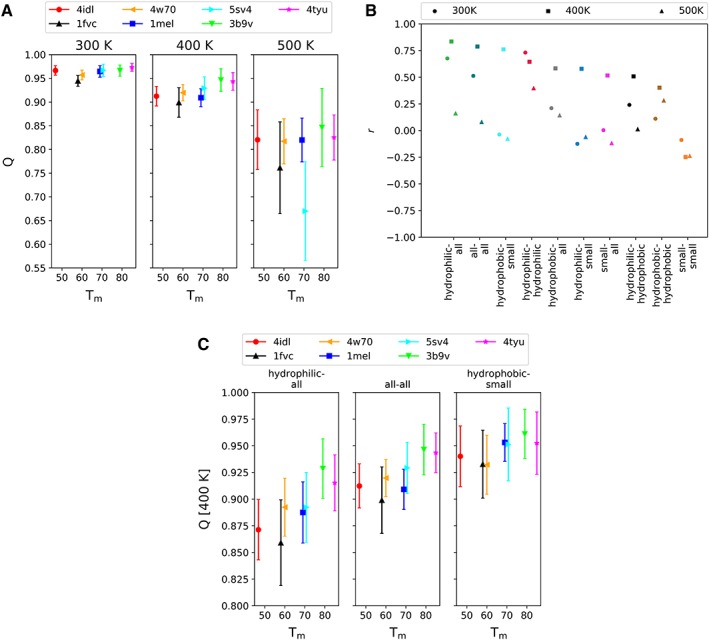
(A) Average Q value over the final 30 ns with standard deviation against the experimental T m per simulation temperature (300 K, 400 K, and 500 K). The data for 4idl, 1fvc, 4w70, 1mel, 5sv4, 3b9v, and 4tyu are shown in red circle, black upper triangle, orange leftward triangle, blue square, cyan rightward triangle, green lower triangle, and magenta star, respectively, with error bars. (B) Pearson correlation coefficient (r) of each average Q value of the described group pairs to the experimental T m for different group combinations and temperatures (300 K, 400 K, and 500 K). The hydrophilic‐all group is the average Q value between the hydrophilic residues (Asp, Glu, Gln, Asn, Arg, Lys, and His) versus all residues, the all–all group is the regular average Q value and the hydrophobic‐small group is the average Q value between the hydrophobic (Phe, Tyr, Trp, Leu, Val, Ile, Met, Cys, and Pro) versus the small (Gly, Ala, Ser, and Thr) residues. (C) Average Q value over the final 30 ns with standard deviation against the experimental T m per group pair [top 3 in Fig. 2(B)] for the 400 K simulations.
