Figure 6.

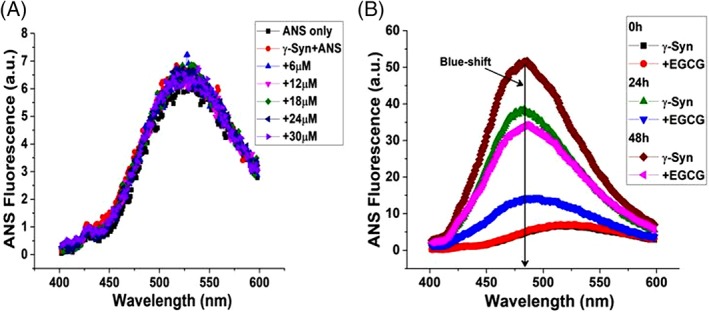
ANS binding to γ‐Syn in the presence of EGCG shows an overall low surface hydrophobicity. (A) Emission spectra of ANS binding to γ‐Syn with increasing concentrations of EGCG. (B) ANS binding to aggregating species of γ‐Syn in the absence and presence of EGCG with a characteristic blue‐shift shown at ~480 nm.
