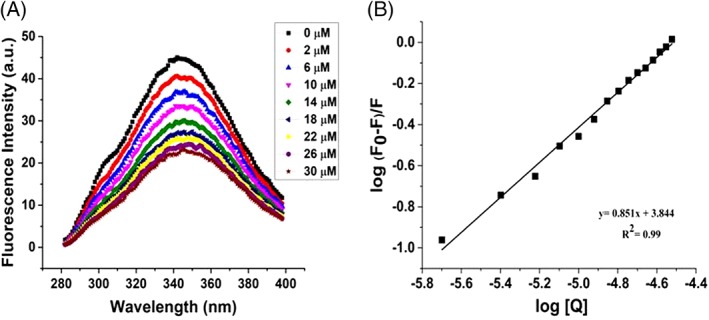
Figure 7.

Steady‐state fluorescence shows the formation of weak binding complex between EGCG and γ‐Syn. (A) Steady‐state fluorescence showing quenching of intrinsic tyrosine fluorescence of γ‐Syn (0.3 mg/mL) continuously titrated with an increasing concentration of EGCG (2–30 μM) at 25°C. (B) Modified Stern–Volmer plot of log (F0–F)/F versus log [Q] showing weak binding interaction between γ‐Syn and EGCG (K a = 6.9 × 10³M−1).
