Figure 8.

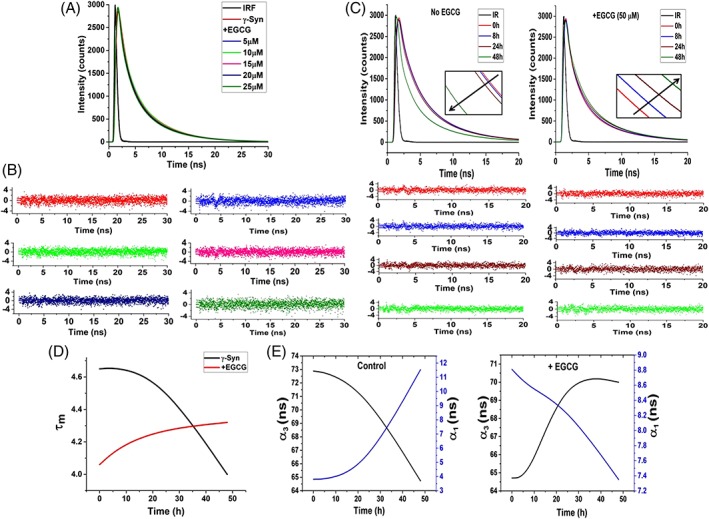
Time‐resolved fluorescence shows static‐quenching mechanism and indicates the formation of conformationally restrained oligomers by EGCG. (A) Time‐resolved fluorescence intensity decay of γ‐Syn under native conditions in the presence of increasing concentrations of EGCG and (B) plots of the autocorrelation function of the weighted residuals used to judge the goodness of the fit (left to right: no EGCG, 5, 10, 15, 20, and to 25 μM EGCG, respectively) . The overlapping decay curves obtained both in the absence and presence of increasing concentration of EGCG depicts a static quenching mechanism. (C) Lifetime decay curves of γ‐Syn oligomers formed at 0, 8, 24, and 48 h of fibrillation both in the absence (left panel) and presence of EGCG (right panel) along with their residuals below their respective decay curves are shown. The time‐dependent decrease in the fluorescence lifetime in the untreated γ‐Syn oligomers and the increase in the fluorescence lifetime in the EGCG‐generated oligomers depicts solvent exposed untreated γ‐Syn oligomers and conformationally restrained EGCG generated γ‐Syn oligomers, respectively. (Inset: shows the change in the fluorescence lifetimes at regular intervals during fibrillation). (D) The plot of average lifetime (τ m) versus the time of fibrillation clearly demonstrates the difference in the decay kinetics in the EGCG‐generated and untreated oligomers. (E) The relationship between the change in the amplitudes of the fastest (τ 1) and slowest (τ 3) time constants (α 1 and α 3, respectively) with respect to the increasing time of fibrillation in the control and EGCG‐treated samples is shown.
