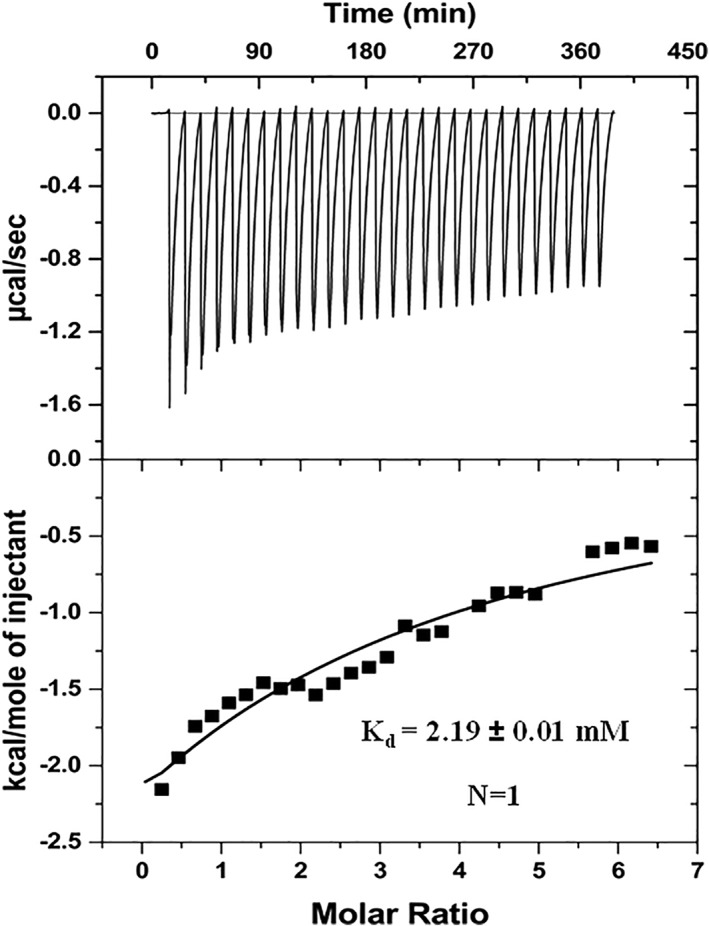
Figure 9.

Isothermal titration calorimetry of EGCG interaction with γ‐Syn shows a weak binding interaction. The interaction was carried out at 25°C with a γ‐Syn and EGCG ratio of 1:30. Upper panel: a raw data plot of heat flow against time for titration of EGCG into γ‐Syn and lower panel: plot of total normalized heat released as a function of ligand concentration for the titration. The solid line shows the one‐site fit for the obtained data.
