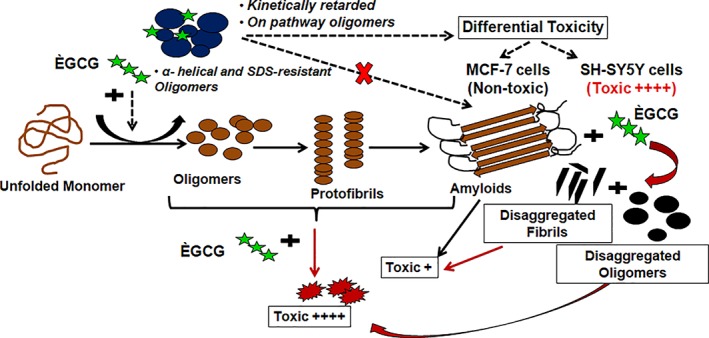
Figure 11.

A schematic representation of the mechanism of EGCG‐mediated modulation of γ‐Syn fibrillation pathway. The figure illustrates the mechanism of EGCG‐mediated modulation of γ‐Syn fibrillation pathway. The black arrows (→) represent γ‐Syn fibrillation pathway in the absence of EGCG, the black dashed arrows (→) represent EGCG modulated γ‐Syn fibrillation pathway and the red arrows ( ) depict disaggregation pathway of γ‐Syn in the presence of EGCG. The cytotoxic effects of both EGCG untreated and treated γ‐Syn species are denoted by ++++ and +, for highly toxic and less toxic effects, respectively.
