
Figure 3.
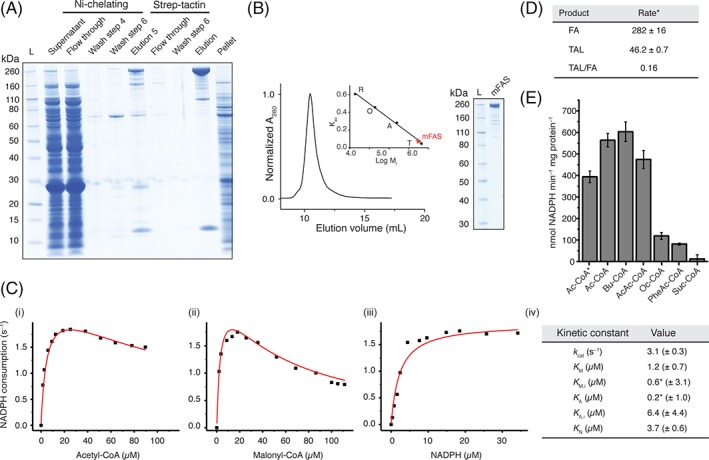
Purification and quality control of mFAS. (A) SDS‐PAGE (NuPAGE 4–12% Bis‐Tris) of tandem affinity purification of mFAS, co‐expressed with Sfp, using Ni‐chelating and subsequent Strep‐Tactin chromatography. mFAS has only little tendency to aggregate, compared to hFAS (see also Figs. S2–S4). (B) SEC of purified mFAS with absorbance normalized to the highest peak. mFAS elutes at an apparent molecular weight of 601 kDa (theoretical weight: 554 kDa). Calibration shown in inset: T, thyroglobulin; a, aldolase; O, ovalbumin; R, ribonuclease. (C) Typical plots of the initial velocity divided by the total enzyme concentration versus the concentration of (i) acetyl‐CoA (19 μM malonyl‐CoA and 30 μM NADPH), (ii) malonyl‐CoA (13 μM acetyl‐CoA and 30 μM NADPH) and (iii) NADPH (13 μM acetyl‐CoA and 19 μM malonyl‐CoA). NADPH consumption was monitored fluorometrically. For curve fitting see Methods section. The asterisk indicates that the ratio of K A/K M,I is well defined, but the absolute value of either is not.21 (D) comparison of the consumption rate of malonyl‐CoA of mFAS for fatty acid (FA) and triacetic acid lactone (TAL) synthesis. The rate is given in nmol malonyl‐CoA consumed per minute and mg protein. Data were collected in biological replicates (n = 3). For FA synthesis, the rate of NADPH consumption was divided by two (one elongation requires two NADPH molecules) and the rate of TAL production was multiplied by two (two elongations deliver one TAL molecule). (E) Specificity of mFAS for different starter units. NADPH consumption assay was performed as described in the Methods section. Substrate concentrations were 100 μM X‐CoA, 100 μM malonyl‐CoA, and 40 μM NADPH, respectively. Ac, acetyl‐CoA; Bu, butyryl‐CoA; AcAc, acetoacetyl‐CoA; Oc, octanoyl‐CoA; PheAc, phenylacetyl‐CoA; Suc, succinyl‐CoA. The asterisk indicates usage of a higher concentration of potassium phosphate (350 mM). Data were collected in biological replicates (n = 3).