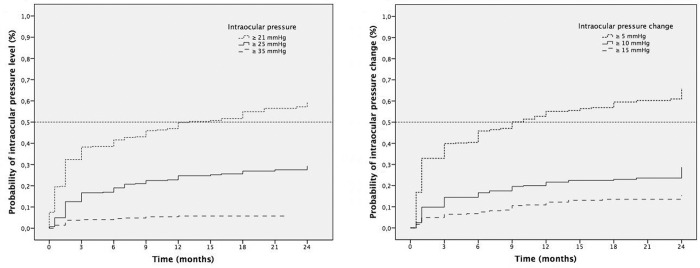
Fig 2. Kaplan-Meier survival analysis of the time to reach an elevated intraocular pressure (IOP) and the change in IOP within 24 months of injection (in months).
Left: Cumulative probability of the different increases in IOP in the months after the first IDI injection (dotted line = IOP ≥21 mmHg, solid line = IOP ≥25 mmHg, stripped line = IOP ≥35 mmHg). Right: Cumulative probability of the different changes in IOP relative to the baseline in months (dotted line = IOP change ≥5 mmHg, solid line = IOP change ≥10 mmHg, stripped line = IOP change ≥15 mmHg).

