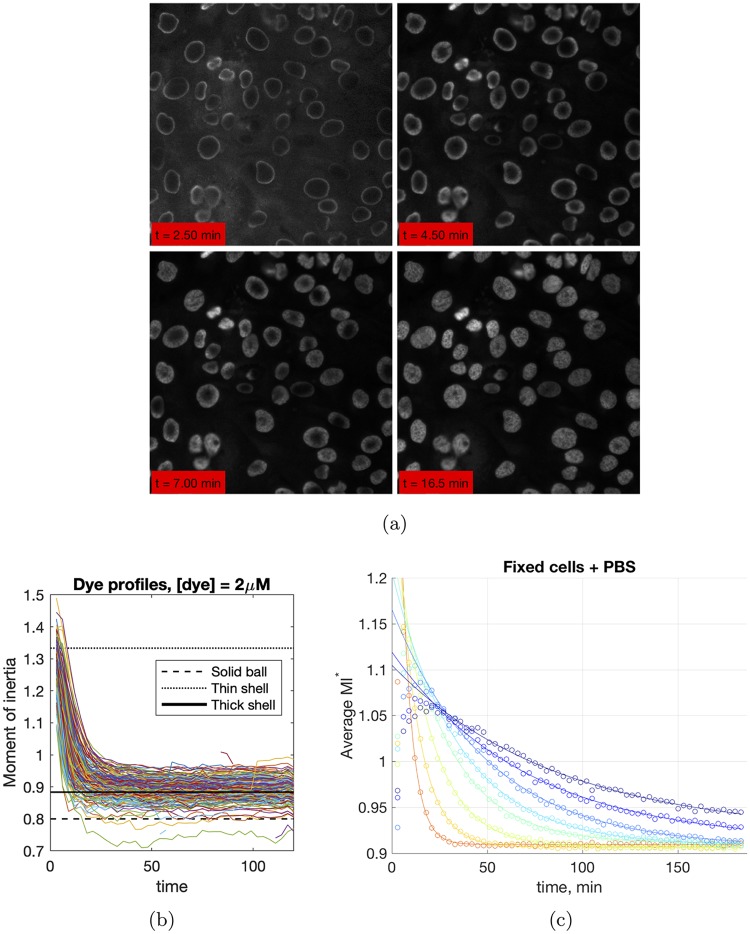
Fig 2.
(a) Reaction front propagation during staining of MFC10A cells with Hoechst dye. (b) Time traces of moment of inertia, M2, for individual cells, [dye] = 2 μM, live cells. The reference lines correspond to the theoretical calculation of M2 for different geometric objects (cf. S1 Text for details). Initially, bound dye is expected to be localized in the thin outer shell of the nucleus. If the distribution of bound sites were uniform throughout a spheroidal nucleus, the expected M2 should correspond to that of a solid ball. The thick shell in the reference plot corresponds to (1/4)R thickness. (c) Time traces of M2 for different dye concentrations, population average, fixed cells.

