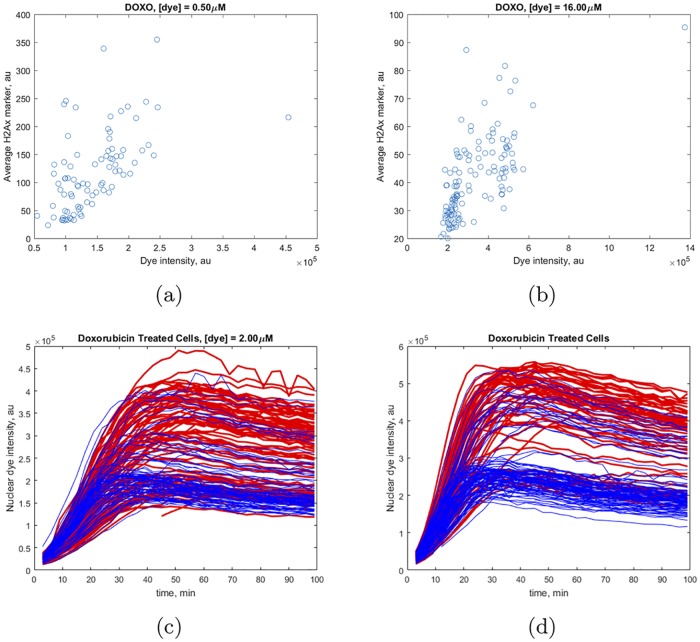
Fig 8. Extent of DNA damage due to doxorubicin treatment vs. Hoechst dye incorporation.
Cells were incubated with [Dox] = 1 μM and (a) [dye] = 0.5 μM or (b) [dye] = 16 μM correspondingly. Time traces of individual cells incubated with [Dox] = 1 μM and (c) [dye] = 2 μM or (d) [dye] = 4 μM. Blue colored traces correspond to a lower extent of DNA damage as determined using the marker γ-H2Ax. Red colored traces correspond to a higher extent of DNA damage.

