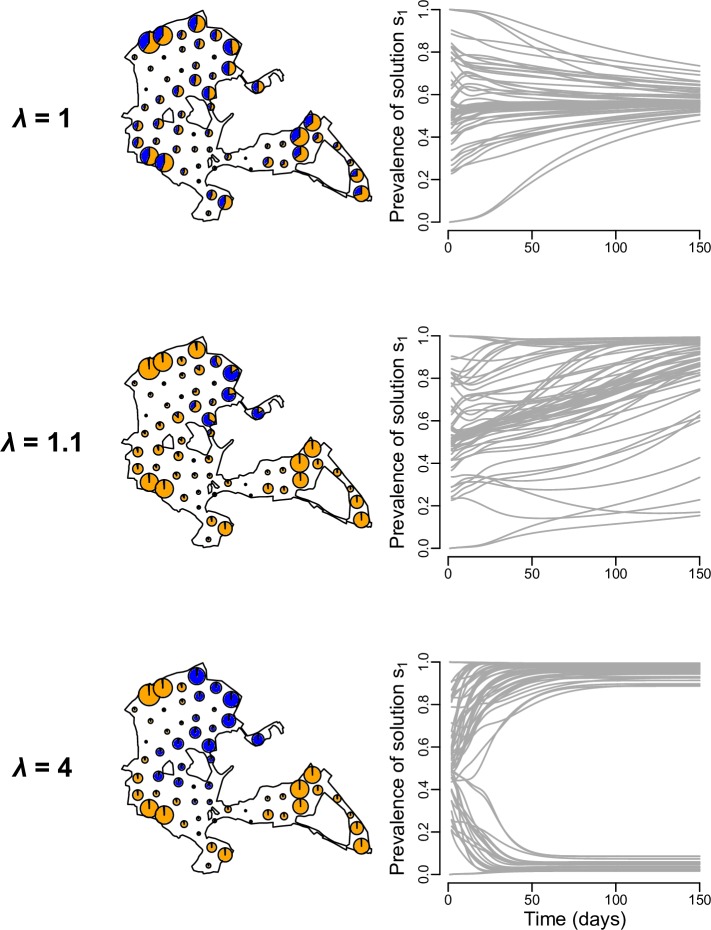
Fig 4. Predictions for the spread of information in a great tit cultural diffusion experiment in Wytham Woods.
This analysis was designed to replicate the conditions of the cultural diffusion experiment performed by Aplin et al. [11], in which two alternative foraging techniques were introduced in the great tits population of Wytham Woods, United Kingdom, and their spread through time monitored. Three examples of the evolution of the prevalence of solution s1 among solvers are shown for the movement rate (m = 0.01) and learning rate (α = 0.007) corresponding to the model best able the replicate the empirical diffusion curves (Fig 3), but with varying conformity strength. The maps represent the extent of Wytham Woods and the location of the 60 internally sited feeders. Each feeder is represented by a pie chart indicating the number of naïve individuals (grey), solvers using solution s1 (orange) and solvers using solution s2 (blue), and the size of the pie chart is proportional to the total number individuals occurring around the feeder (i.e. the size of the sub-population). The right column shows the evolution of the prevalence of solution s1 among solvers at each feeder (each grey line represents a feeder). When no conformity bias was included (λ = 1) the model predicted a mixture of solutions in every sub-population; when conformity was relatively weak (λ = 1.1) the system tended to converge towards solution s1 dominating; and when conformity was relatively strong (λ = 4) local traditions emerged.

