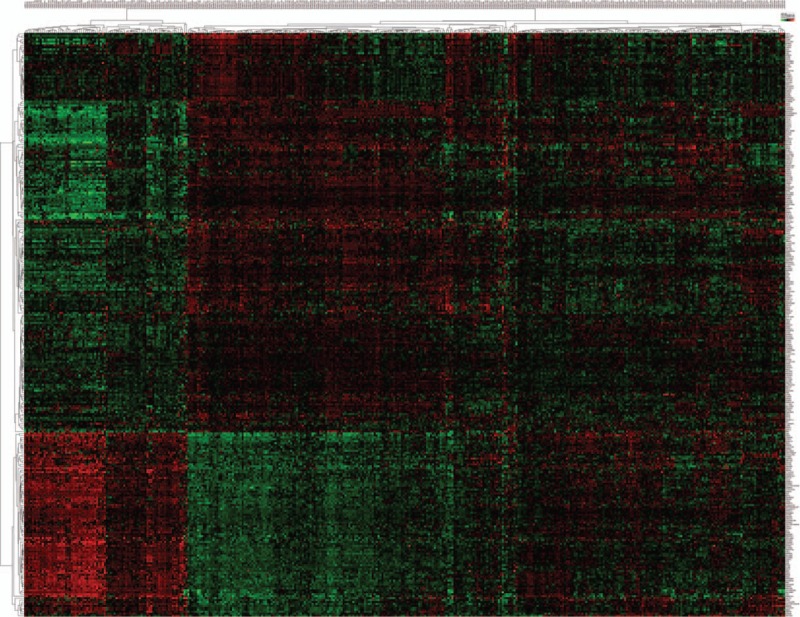
Figure 4.

Heatmap of the 301 TCPTC-specific DEGs. Hierarchical analysis of the 301 TCPTC-specific DEGs based on their expression values in the TCPTC and cPTC tissues. All values are presented as log10 (RSEM), DEGs = differentially expressed genes, cPTC = classical/conventional variant Papillary Thyroid Carcinoma, RSEM = RNAseq by expectation-maximization, TCPTC = tall cell variant papillary thyroid carcinoma.
