FIGURE.
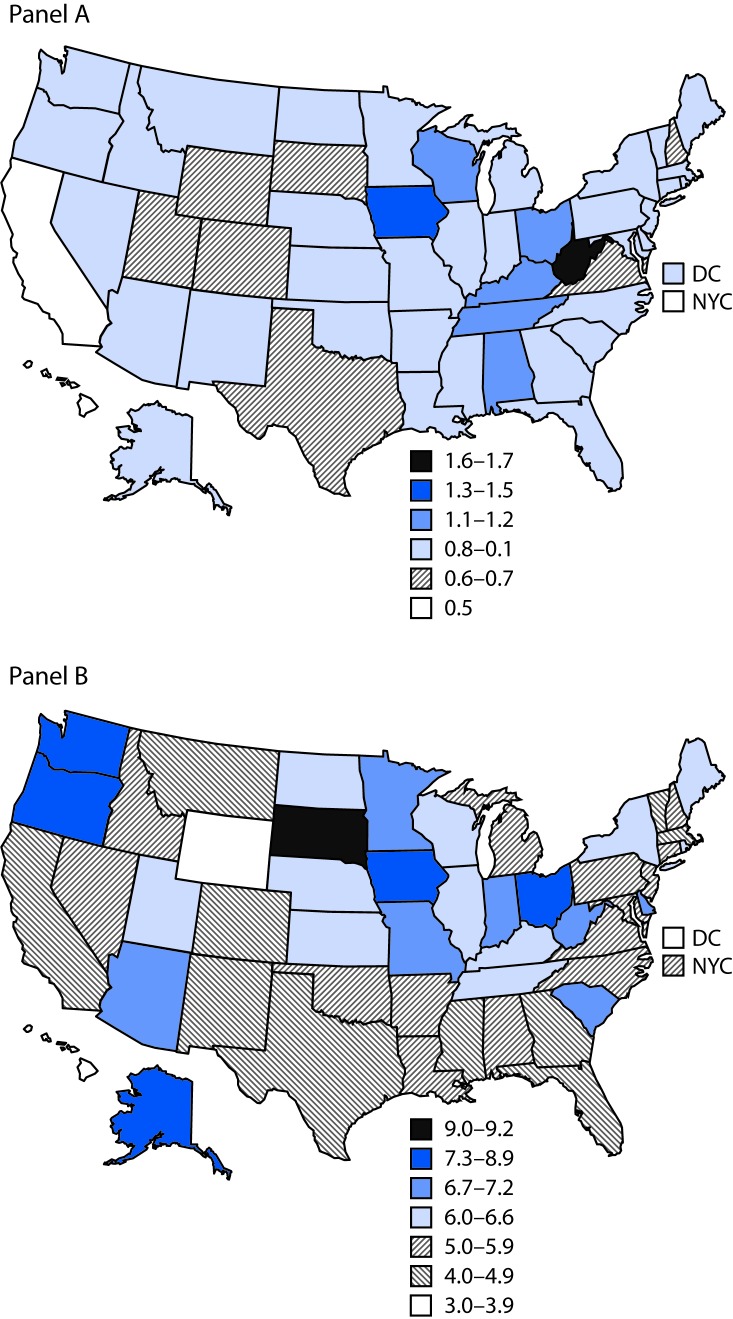
Standardized* prevalence of preexisting (panel A) and gestational (panel B) diabetes among women who had a live birth — United States, 2016
Abbreviations: DC = District of Columbia; NYC = New York City.
* Standardized to age and race/ethnicity distribution of U.S. resident mothers delivering in 2012.

