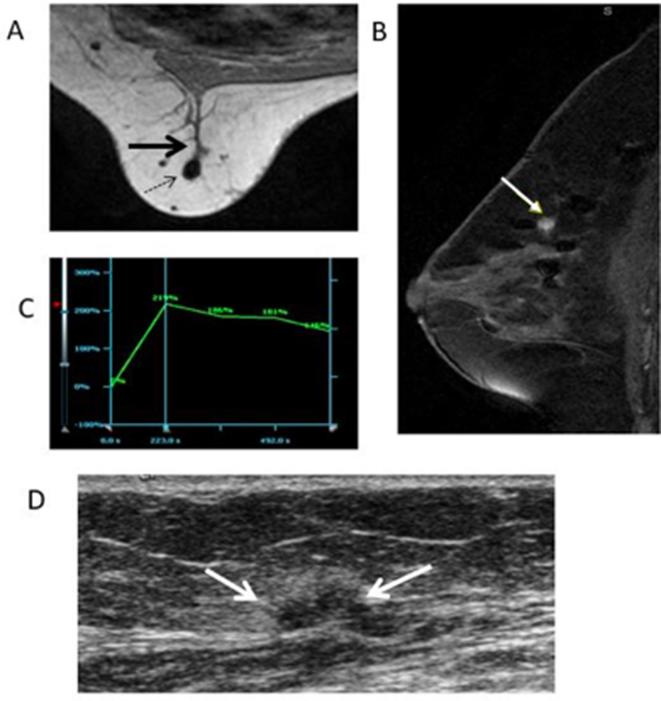
Figure 9.
59-year-old female with history of atypical ductal hyperplasia, status post-segmental mastectomy presents for high-risk screening. (A) Axial T1 weighted non-fat-saturated image shows an ill-defined mass (black thick arrow) adjacent to a surgical clip (dotted black arrow). (B) Sagittal T1 enhanced and fat-suppressed image shows the mass enhances with contrast (yellow arrow). (C) Graph of the kinetic curve confirms the mass has a wash-in and wash-out curve. (D) Second look ultrasound shows the enhancing mass correlates with an irregular, hypoechoic mass (white arrow) and hyperechoic halo. Core biopsy showed fat necrosis.

