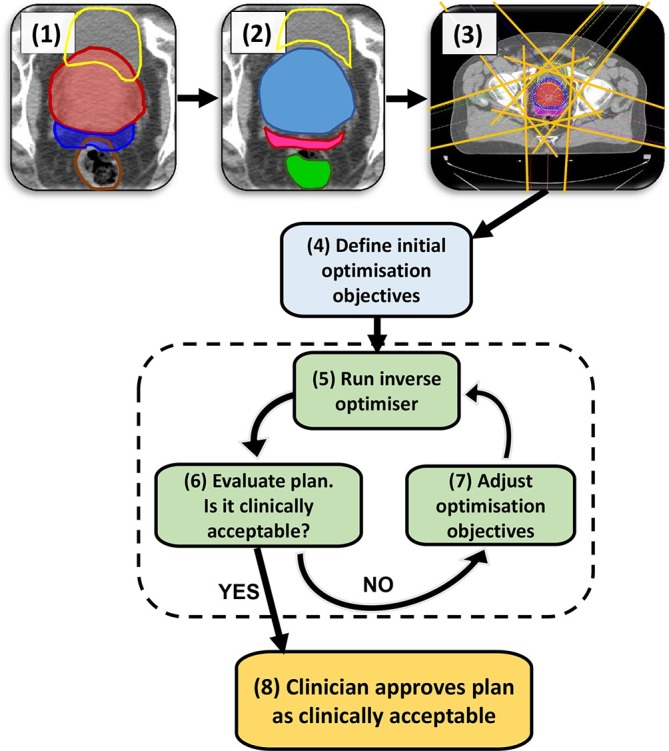
Figure 1.

A typical manual IMRT treatment planning pathway. The example shown is for a prostate + seminal vesicle case. The steps are as follows: (1) CT scan with PTVs and OARs delineated; here the colours of ROIs are red: Prostate PTV, dark blue: SV PTV, yellow: bladder OAR, brown: rectum OAR. (2) create a range of “helper” (ROI) to aid the optimiser; e.g. the part of an OAR not overlapping with the PTV, PTVs overlapping with each other, ring structures to control dose spillage. In the example in Step 2, the ROIs shown are yellow: bladder cropped from prostate PTV, green: rectum cropped from seminal vesicle PTV, magenta: SV PTV cropped from prostate PTV, blue: prostate PTV unedited as it is the higher dose prescription than SV PTV. Step (3) set-up beam geometry. (4) Define the initial optimisation objectives either from scratch or from a class solution. (5) Run the inverse optimiser until it converges to a solution, calculate dose distribution. (6) Evaluate the resulting plan, if it is clinically acceptable proceed to Step 8, otherwise go to Step 7 to adjust the optimisation objectives. The part shaded in green (steps 5, 6, 7) is the iterative process of optimisation required by the planner to arrive at a clinically acceptable treatment plan to be approved by the clinician in Step 8. After this step, the plan will go through the quality control process and preparation for treatment, not shown on the flow chart. IMRT, intensity modulated radiotherapy; OAR, organ at risk; ROIs, regions of interest; PTV, planning target volume; SV, seminal vesicle.
