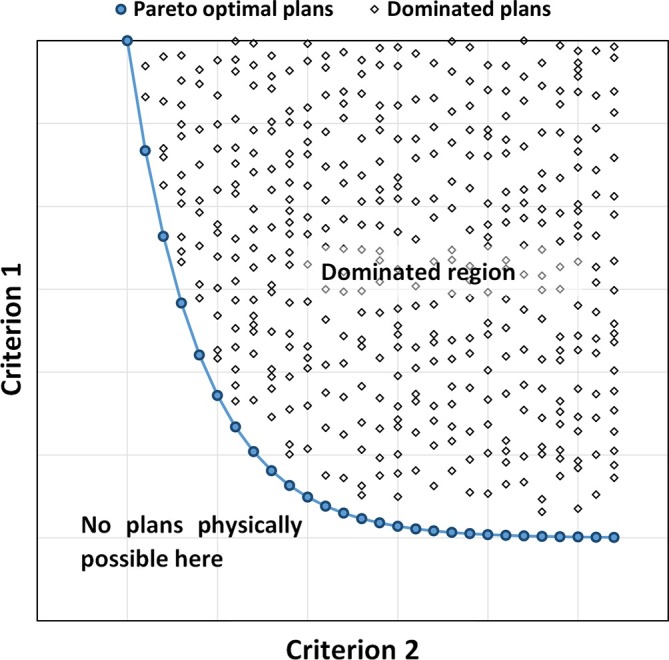
Figure 4.

Schematic diagram of two competing criteria. The graph shows a large number of different feasible planning solutions, representing a variety of different permutations for criterion 1 and 2. The solid line represents the pareto front where improving one criterion inevitably leads to the worsening of the other and vice versa. Plans that lie on this front are the “pareto optimal solutions”, shown as blue circles in the schematic. The plans shown as diamonds are referred to as “dominated” because there is always a solution on the pareto front where at least one criterion can be improved.
