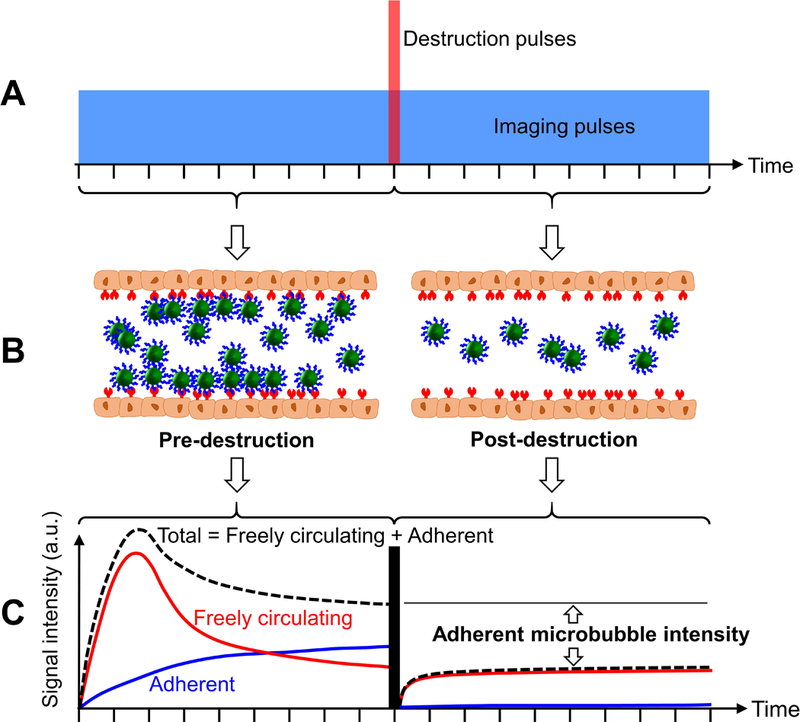
Figure 2.

Schematic illustrations and algorithm for the destruction-replenishment method. (A) Pulse sequence of the method. The vertical (red) bar indicates the highintensity destruction pulses used to burst all the freely circulating and adherent microbubbles within the field of view. The horizontal (blue) box indicates the imaging pulses. The amplitudes of the destruction and imaging pulses are not to scale. (B) Graphical illustrations of microbubble dynamics in pre- and post-destruction stages. (C) The total acoustic signal intensity is the summation of freely circulating microbubble intensity and adherent microbubble intensity. The adherent microbubble intensity is achieved by subtracting the post-destruction intensity (assumed to be freely circulating microbubbles) from the pre-destruction intensity (assumed to be adherent microbubbles and freely circulating microbubbles). (C) is adapted from Steinl and Kaufmann [162], under Creative Commons Attribution License (2015).
