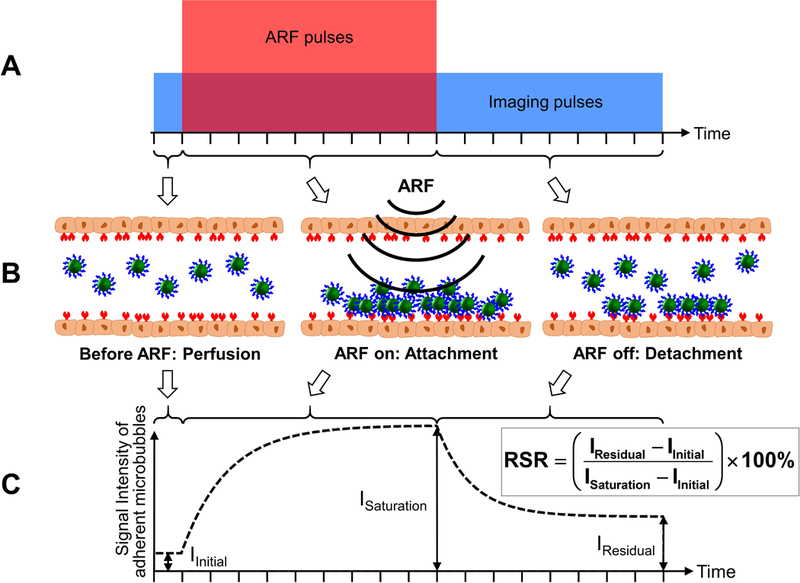
Figure 4.

Schematic illustrations and algorithm for the modulated acoustic radiation force (ARF)-based method. (A) Pulse sequence of the method. The tall (red) box indicates the acoustic radiation force (ARF) pulses. The wide (blue) box indicates the imaging pulses. The amplitudes of the ARF and imaging pulses are not to scale. (B) Graphical illustrations of microbubble dynamics in the three stages: before ARF, ARF on, and ARF off. (C) Signal intensity of adherent microbubbles on the bottom vessel wall. IInitial represents the signal intensity of the baseline. ISaturation represents the signal intensity with saturated adherent microbubbles. IResidual represents the signal intensity of remaining adherent microbubbles after the cessation of ARF. Residual-to-saturation ratio (RSR) is calculated based on the equation above and is used to quantify the adherent microbubble concentration. Adapted from Wang et al. [115,116] with permission, ©Copyright, Elsevier B.V., 2015 (A); © Copyright, 2014, Institute of Physics and Engineering in Medicine (C).
