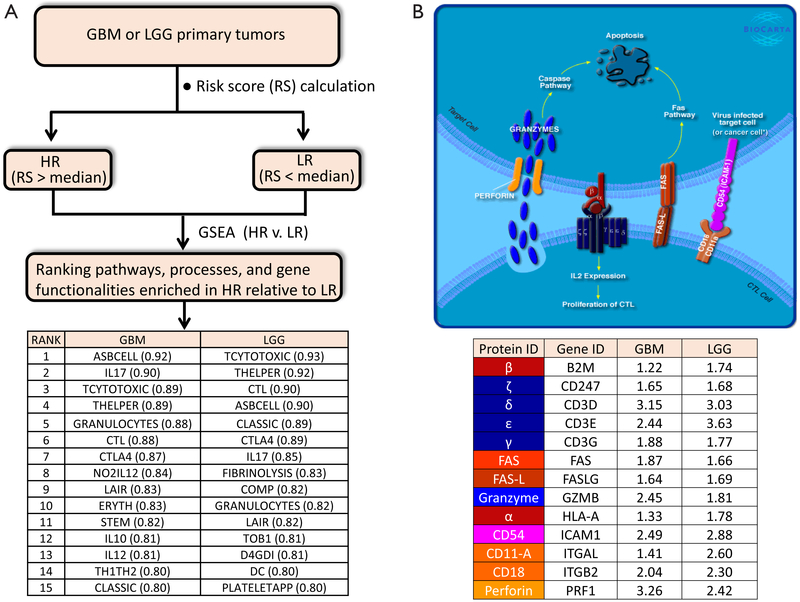
Figure 1.
(A) A scheme to identify the molecular pathways and functionalities associated with elevated Risk Score (Cheng et al., 2016) in GBM and LGG. The top 15 Biocarta pathways (the ones exhibiting highest Enrichment Scores) for each cohort are mostly immune-related; (B) one of the pathways predicted to be upregulated in high risk (HR) relative to low risk (LR) GBM or LGG is the CTL pathway (cytotoxic lymphocyte mediated immune response against target cells), accessible at http://cgap.nci.nih.gov/Pathways/BioCarta_Pathways. Detailed descriptions of all the Biocarta pathways can be found at http://software.broadinstitute.org/gsea/msigdb/genesets.jsp. The inset table shows that many of the genes involved in the CTL pathway are upregulated in HR relative to LR cases (the numbers shown represent fold-change, calculated using Gene-E from Broad Institute). *, the original Biocarta figure for the CTL pathway does not include the text “or cancer cell”, which was added to emphasize that the antigen presenting cell may also be a cancer cell (e.g., glioma cell). Permission to use and modify the figure was granted by Biocarta.

