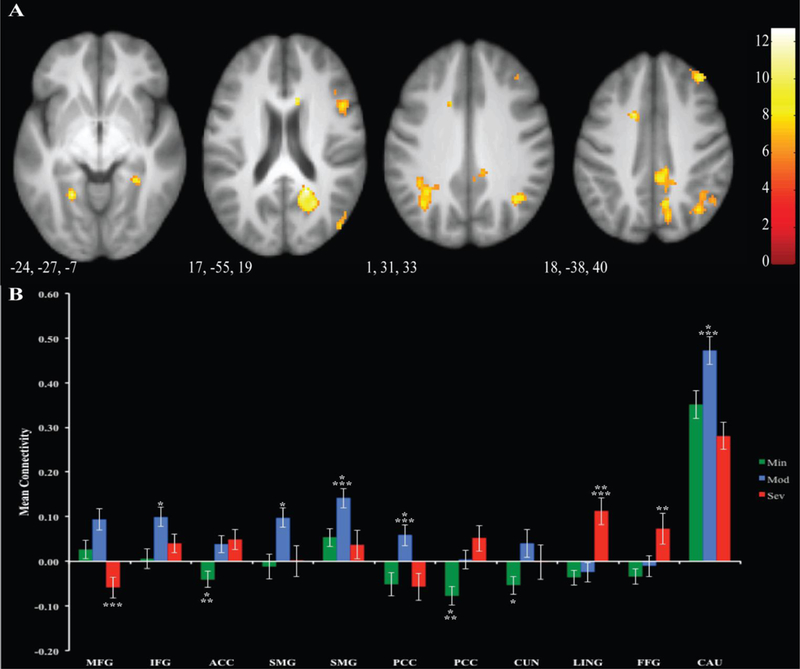
Figure 3. Differences in Connectivity to LVSs seed.

Regions of significant differences between groups are displayed in Panel A. Mean connectivity for each group is illustrated for each cluster in Panel B. Error bars represent 1 standard error. Significant relationships between clusters are denoted by asterisks.: *=p<.05 between Min and Mod ** =p<.05 between Min and Sev, ***= p<.05 between Mod and Sev, MFG=Middle Frontal Gyrus, IFG=Inferior Frontal Gyrus, ACC=Anterior Cingulate, SMG=Supramarginal Gyrus, PCC= Posterior Cingulate Cortex, LING= Lingual Gyrus, FFG=Fusiform Gyrus, CAU=Caudate
