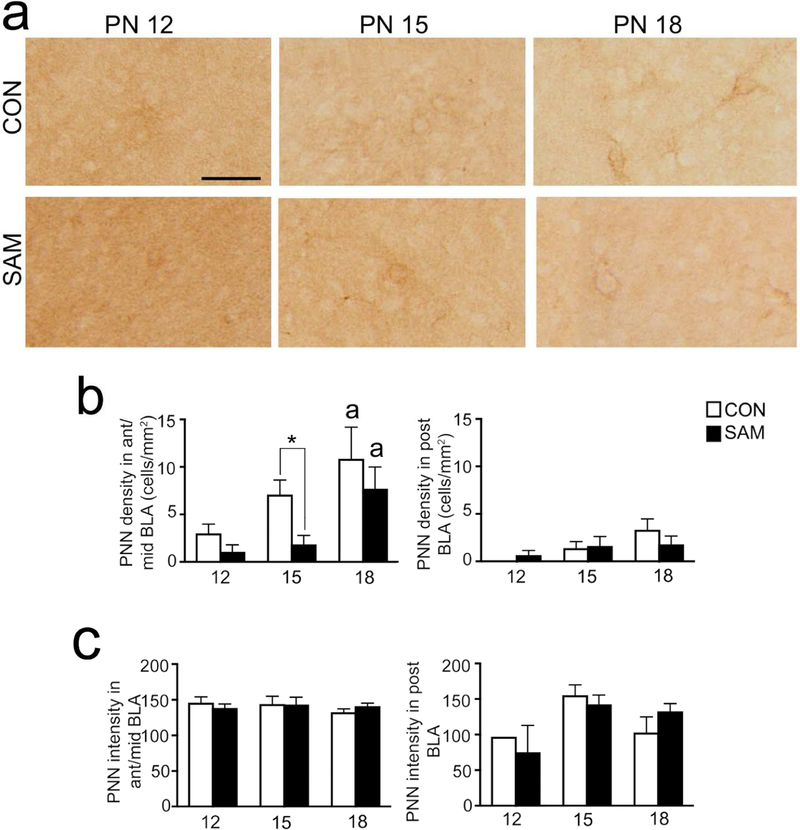
Figure 7. PNN ontogeny in the BLA.
Panel a: PNN cells were examined in the BLA of SAM and CON rats at PN12, PN15, and PN18. Micrographs show details of sample PNNs. All panels were taken at a magnification of 10X. Scale bar = 20 µm and applies to all panels). Panels b and c: The graphs show developmental changes in PNN density (panel b) and PNN intensity (panel c) of CON and SAM brains during pre-weaning ages, separately for anterior-to-mid (left graph) and posterior (right graph) levels of BLA. Bars represent mean and SEM. In ant/mid BLA, PNN cell density was transiently reduced by SAM at PN 15. In posterior BLA, PNN cell density was not reduced at younger ages, as was observed at PN23 (Fig. 4). PNN density rises during pre-weaning ages, reaching a plateau at PN18 for CON brains but not yet plateaued at this age for SAM brains at anterior-to-mid levels. # in panel b represents significant rearing effects at a particular age (p=0.032), even though two-way ANOVA indicated a p-value >0.05. The small alphabets above the bars depict significant differences between age groups within the same rearing condition with: a=significantly different from PN12; b=significantly different from PN15; c=significantly different from PN18.

