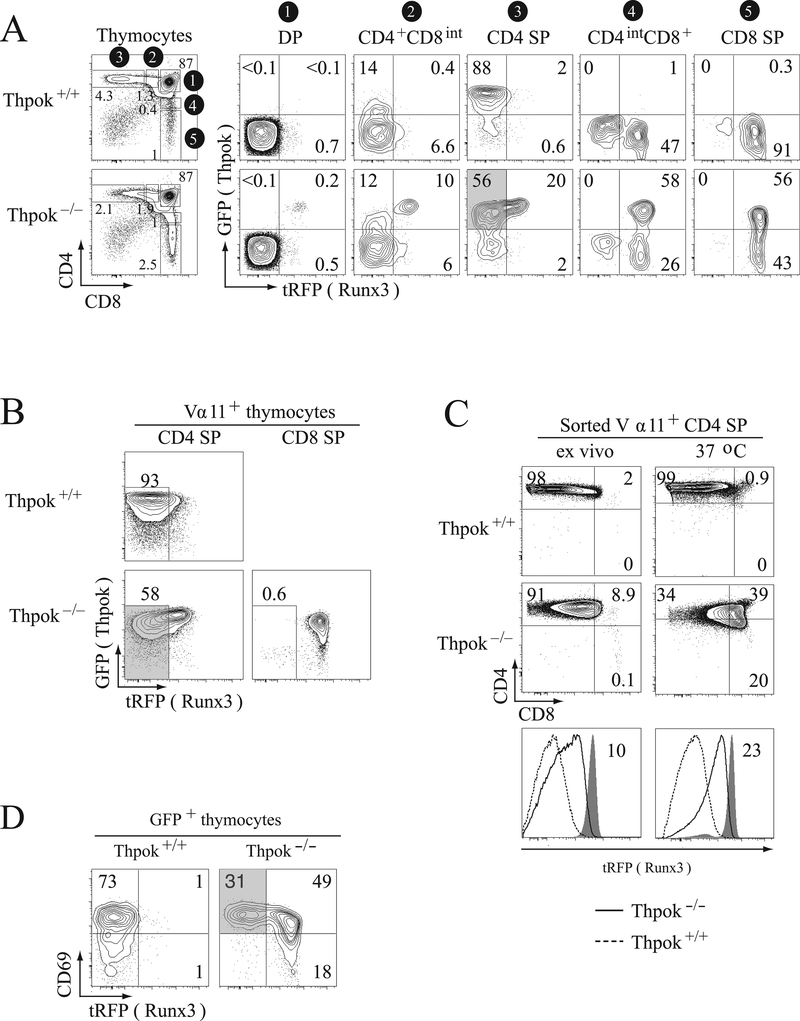
Figure 1. Runx3 repression during CD4-lineage differentiation.
(A) Contour plots show expression of ThpokGFP and Runx3tRFP reporters in the indicated thymocyte subsets from Thpok+/+ and Thpok−/− mice (gating on the left, gate numbers shown on a black background). Note the expression of ThpokGFP in the CD4intCD8+ and CD8 SP subsets in Thpok−/− mice, identifying MHC II-restricted ‘redirected’ thymocytes. The gray-shaded box in column 3 (bottom) contains ThpokGFP+ Runx3tRFP– cells. (B) Contour plots of ThpokGFP and Runx3tRFP expression in Vα11+ CD4 or CD8 SP thymocytes from Thpok−/− and Thpok+/+ mice carrying the MHC-II-restricted AND TCR transgene; gates are defined in Supporting Information Fig. 1. The gray-shaded area identifies ThpokGFP+ Runx3tRFP– cells. (C) Sorted CD4 SP thymocytes from Thpok+/+ or Thpok−/− AND mice carrying the Runx3tRFP reporter were placed in single cell suspension culture overnight and analyzed for expression of surface CD4 and CD8 (top) and tRFP (bottom) before (left) and after (right) culture. Overlaid histograms (bottom) show Runx3tRFP expression in Thpok−/− (solid line histogram) or Thpok+/+ (dashed line histogram) cells. Gray-filled histograms show tRFP fluorescence in CD8 SP cells from AND Thpok−/− mice analyzed in parallel. Numbers in bottom panels indicate tRFP fluorescence relative to CD8 SP controls (gray-shaded histograms) set to 100. (A-C) In each panel, data shown are representative of at least three experiments. (D) Contour plots of CD69 vs. tRFP expression gated on GFP+ thymocytes from Thpok+/+ or Thpok−/− mice carrying both the ThpokGFP and Runx3tRFP reporters. The gray-shaded area identifies the CD69hi GFP+ tRFP– subset in Thpok−/− mice.

