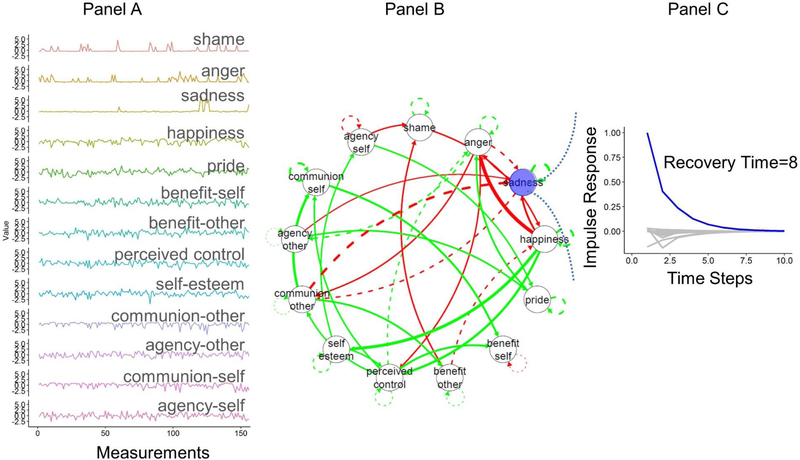
Figure 2.
Illustration of the time-series, network graph, and impulse response analysis for one individual. Panel A is the standardized time-series of 13 variables of one burst from one individual. Panel B is the network graph of the temporal relations in the time-series from Panel A, obtained using uSEM. Panel C is the time profile of the impulse response analysis of the network in Panel B (sadness = blue line, the other twelve variables = grey lines).

