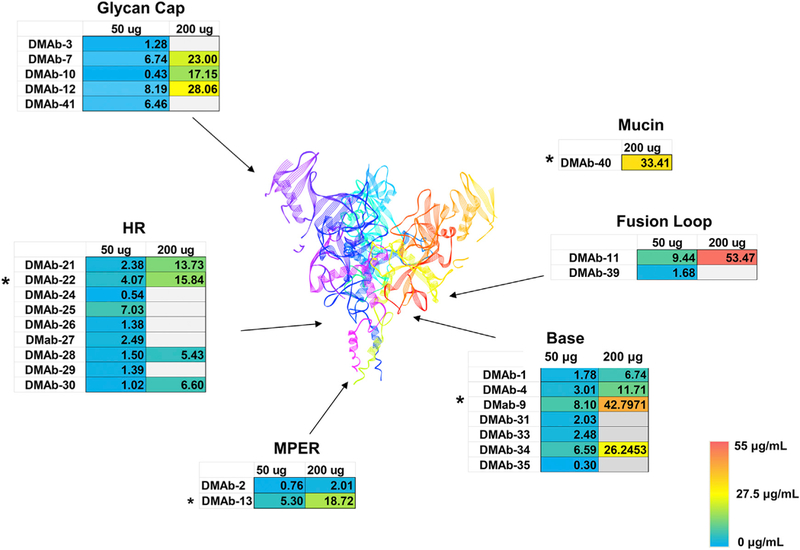
Figure 1. Cmax Expression Levels for 26 Different Optimized DMAbs Targeting Various Regions of EBOV GP.

Optimized anti-GP DMAbs targeting the glycan cap, heptad repeat region 2 (HR2), membrane-proximal external region (MPER), base, fusion loop, and mucin-like domain were evaluated at 50 µg/mouse and 200 µg/mouse. Expression was assayed at day 7 post-DMAb administration. The gray box represents groups that were not evaluated for dose 2. Structure shown is based on Ebola virus GP PDB:5JQ3 (Zhao et al., 2016). A heatmap scale bar is included for colorimetric reference (0–55 µg/mL). Asterisks represent DMAbs that were optimized later during the study. The data represent the mean of n = 5 mice/group. Expression data for individual animals in each group are included in Supplemental Information.
