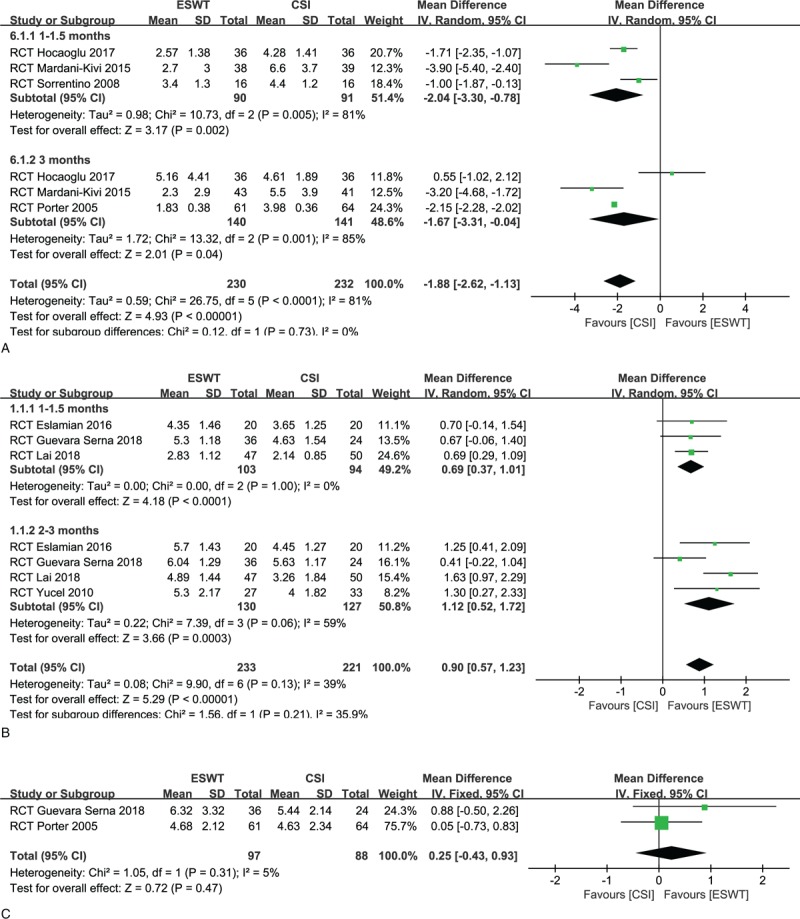
Figure 2.

(A) Forest plots of visual analog scale (VAS) reduction in low-intensity extracorporeal shock-wave therapy (ESWT) group and corticosteroid injection (CSI) groups within 3 months. (B) Forest plots of VAS reduction in high-intensity ESWT group and CSI groups within 3 months. (C) Forest plots of VAS reduction in ESWT group and CSI groups at 12 months.
