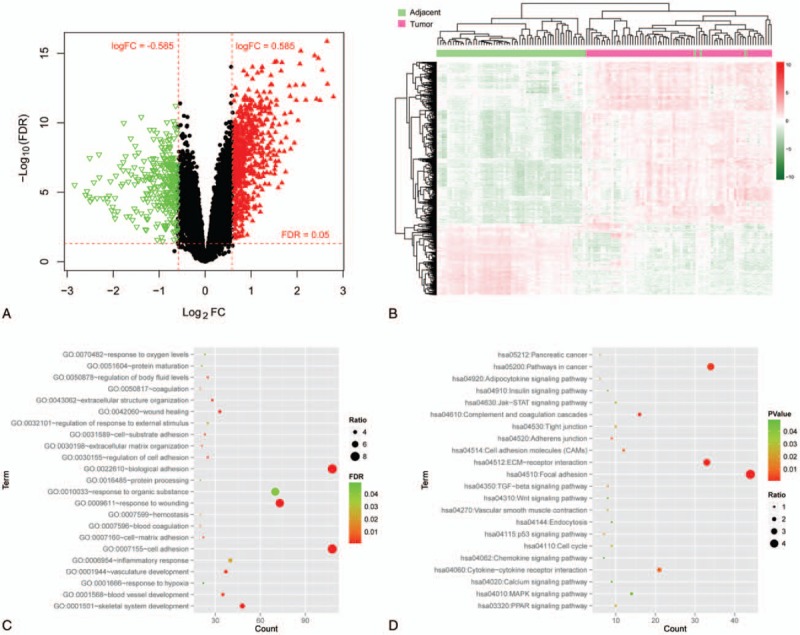
Figure 1.

Identification of DEGs and functional enrichment analysis. (A) Volcano plot of the DEGs. Red horizontal dotted line represents the threshold line of false discovery rate = 0.05; red vertical dashed line indicates the threshold line of |log2FC| > 0.585. Red triangle represents significantly up-regulated gene, green inverted triangle represents significantly down-regulated gene, and black dot indicates non-DEG. (B) Heat map of DEGs. Red indicates up-regulation and green indicates down-regulation. In the above sample bar, the green represents adjacent normal samples and light purple indicates pancreatic cancer tumor tissue. Enriched Gene Ontology biology process terms (C) and Kyoto Encyclopedia of Genes and Genomes pathways (D) of DEGs. The abscissa represents the number of genes involved in the corresponding biological processes and pathways, and the ordinate indicates the biological process and the pathway. The color of the point from green to red indicates a significant change in the value of P from small to large, and the size of the point indicates ratio (ratio = number of genes involved in function or pathway/number of background genes). DEGs = differentially expressed genes, FC = fold change.
