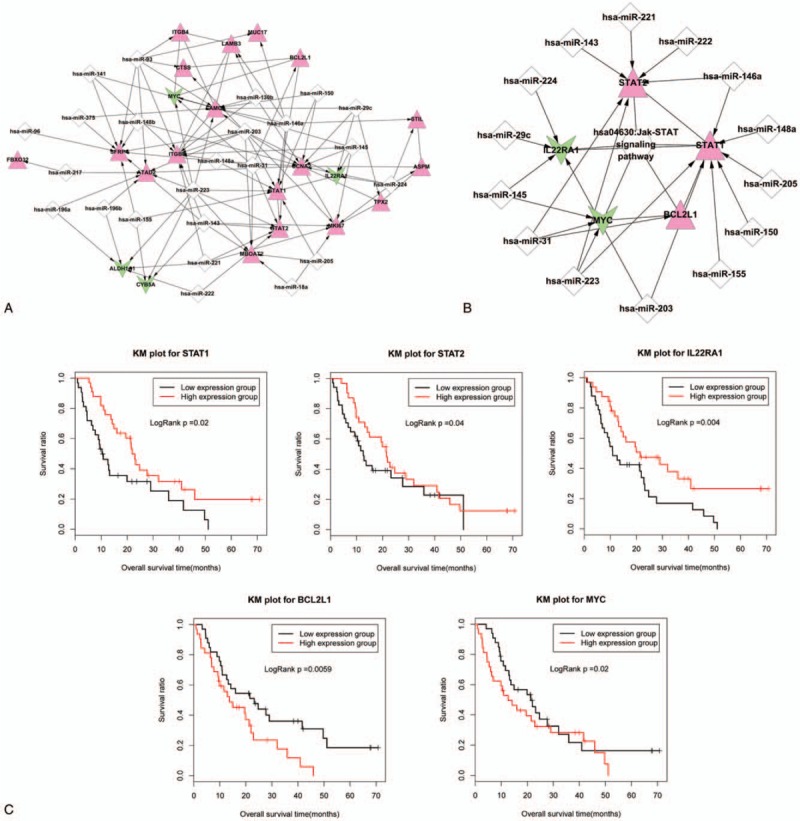
Figure 3.

miRNA regulatory networks and Kaplan–Meier curves of 5 genes involved in Jak-STAT signaling pathways. (A) miRNA regulatory network constructed based on the 24 pancreatic cancer-related miRNAs and their target prognostic-related genes. The red triangle represents up-regulated gene, the green inverted triangle represents down-regulated gene, and the white diamond represents the pancreatic cancer-related miRNA. The edge of arrow indicates that the miRNA-gene interaction and the linkage without arrow indicates gene–gene interaction. (B) Jak-STAT signaling pathway-related miRNA regulatory network. The red triangle represents up-regulated gene, the green inverted triangle represents down-regulated gene, the white diamond represents the pancreatic cancer-related miRNA, and the circular node represents the Jak-STAT signaling pathway. The edge with arrow indicates that the miRNA-target gene linkage, and the edge without arrow indicates linkage between gene and the pathway. (C) The Kaplan–Meier curves of the 5 genes involved in the Jak-STAT signaling pathway. The red curve shows high-expression group and the black curve shows low-expression group.
