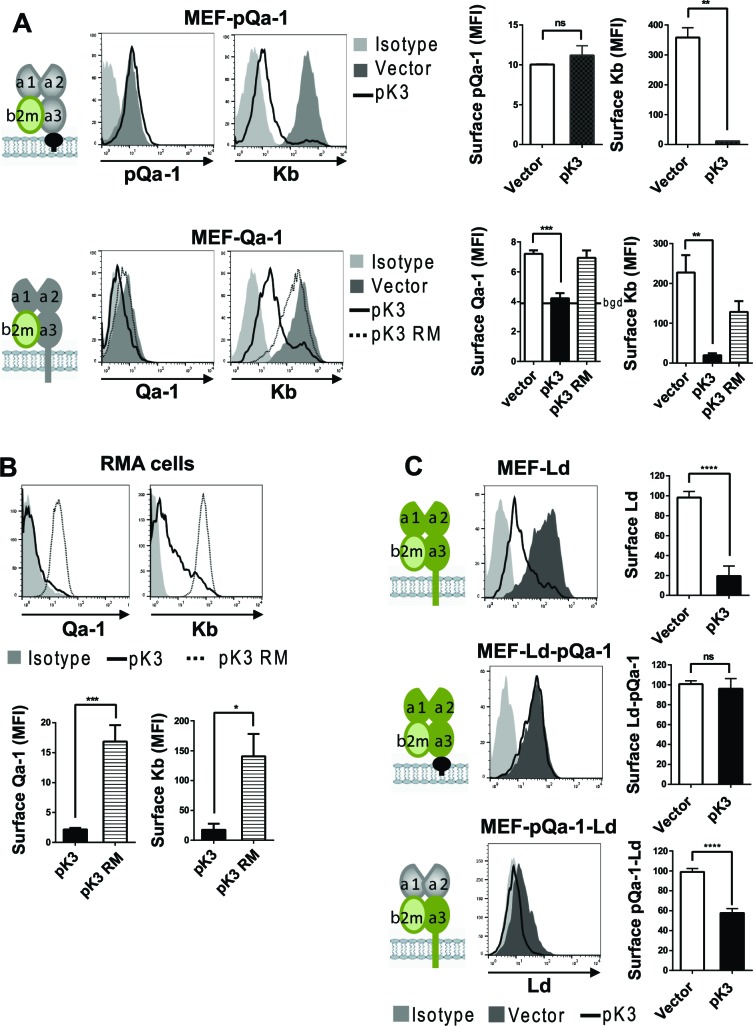
Figure 4. Qa-1 is sensitive to pK3-induced downregulation while pQa-1 is resistant.
(A) MEF-pQa-1 (upper panel) or MEF-Qa-1 (lower panel) cells were transduced with vector, pK3 or pK3 RING mutant (pK3 RM). Surface pQa-1/Qa-1 levels were determined by anti-HA/anti-Qa-1 staining. Surface expression of endogenous MHC-I Kb on these cells served as a positive control of pK3 function. (B) Surface expression of endogenous Qa-1 on RMA cells in the presence of vector, pK3 or pK3 RM were analyzed similarly. (C) Surface levels of classical MHC-I Ld, chimeric Ld-pQa-1 or chimeric pQa-1-Ld (as depicted by cartoons) on MER cells in the presence of vector or pK3 were analyzed. Quantification of median fluorescence intensity (MFI) in (A and B) or relative surface levels in (C) from two to four analyses are shown as bars with mean ±SEM. Unpaired t test or one-way ANOVA Dunnett's multiple comparisons test was used (*=p < 0.05; **=p < 0.01; ***=p < 0.001; ****=p < 0.0001; ns = not significant).

