. 2018 Dec 21;7:e38667. doi: 10.7554/eLife.38667

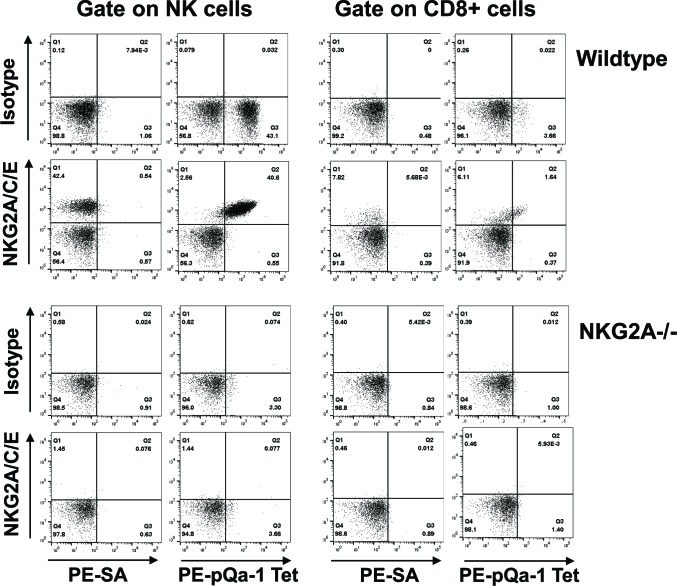
Figure 5. The Qdm-β2m-pQa-1 single chain trimer (SCT) specifically recognizes the CD94/NKG2A receptor.

(A) Spleen lymphocytes isolated from wildtype C57BL/6 or NKG2A-/- knockout mice were stained with PE-labeled pQa-1-dtSCT tetramer (PE-pQa-1 Tet), or PE-labeled streptavidin (PE-SA) as negative control, at room temperature for 1 hr followed by staining with a mixture of fluorochrome labeled antibodies containing either anti-NKG2A/C/E (20D5) or isotype control for 30 min. The stained cells were acquired by BD Canto II and data were analyzed with FlowJo software. Representative data of four (wildtype) and two (NKG2A-/-) independent experiments are shown. NK cells were defined as the live NK1.1+CD3-CD19- population, while CD8 T cells were gated on the live CD19- CD3+CD8+ population.

Figure 5.

Figure 5—figure supplement 1. pQa-1 single chain trimer design and increased thermal stability.
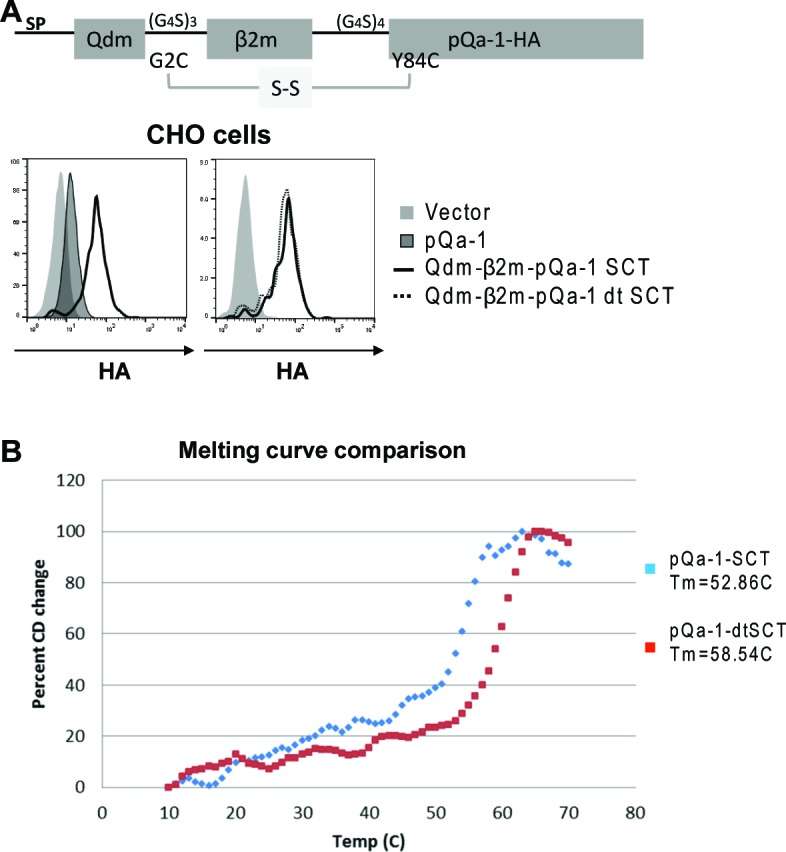
Figure 5—figure supplement 1.

(A) Schematic depiction of pQa-1-SCT. A disulfide-trapped version (dtSCT) was made by substitutions of Linker1 G2C and pQa-1 Y84C. Surface expression of pQa-1-SCT on CHO cells was compared with pQa-1 (left) or with pQa-1-dtSCT (right) by FACS analysis. (B) Thermostability of pQa-1-SCT or pQa-1-dtSCT was measured by circular dichroism (CD) as described (Mitaksov et al., 2007). The increase in the CD signal at 220 nm as a function of temperature was normalized on a scale of 0 to 100. The Tm for each protein is denoted in the legend. For these thermal denaturation studies, purified pQa-1-SCT proteins were dialyzed against buffer containing 10 mM K2HPO4/KHPO4pH = 7.5 and 150 mM NaCl, and diluted to 475 nM in buffer containing 20 mM K2HPO4/KHPO4pH = 7.5 and 150 mM NaCl. Circular dichroism (CD) spectra at 10°C were collected between 260 and 200 nm at 0.5 nm increments on a Jasco-810 instrument (Jasco Inc., Easton MD) equipped with a Peltier temperature controller. The thermal denaturation profiles were monitored by the change in CD signal at 220 nm as a function of temperature. Thermal scan data were collected at 1.0°C intervals from 10°C to 70°C with a temperature ramp rate of 50 °C/hour. Thermal denaturation curves were scaled from 0% to 100% to provide plots of the percent of signal change versus temperature. The Tm is the temperature at which the CD signal change is half of the total signal change. All measurements were made at least four times and averaged.
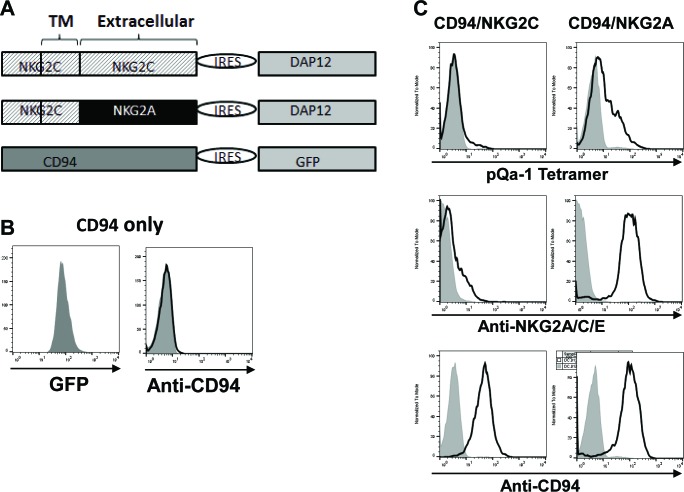
Figure 5—figure supplement 2. pQa-1-dtSCT tetramer stains CD94/NKG2A expressing cells stronger than CD94/NKG2C-expressing cells.

Figure 5—figure supplement 2.

(A) Schematic depiction of the constructs for expression of CD94, CD94/NKG2C or CD94/NKG2A. (B) Mouse T lymphoma cell line BWZ.36 expressing CD94 alone indicated by GFP could not be detected by surface anti-CD94 staining. (C) BWZ.36-CD94 cells in (B) co-expressing NKG2C and DAP12 or NKG2A and DAP12 were stained by pQa-1-dtSCT tetramer, anti-NKG2A/C/E or anti-CD94, respectively. Parental BWZ.36 cells served as background (shaded peak). The data shown in (B) and (C) had been observed repeatedly.