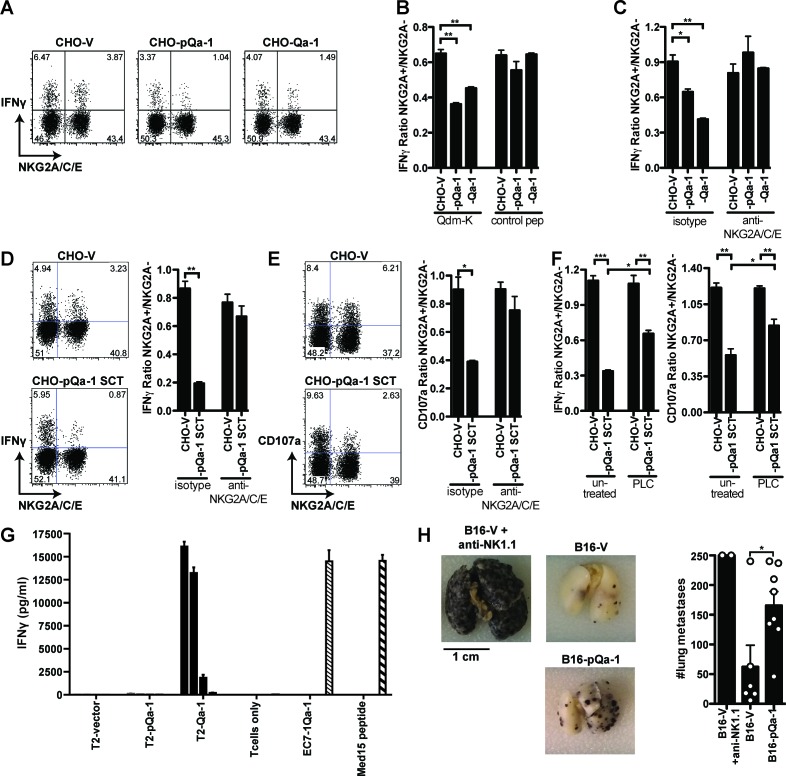
Figure 6. Expression of pQa-1 bound with Qdm/Qdm-like peptide inhibits NKG2A+ NK cell activation and prevents tumor rejection in vivo.
C57BL/6 splenocytes were co-cultured with CHO cells expressing the indicated constructs and the NK cells were subsequently analyzed by flow cytometry (A–F). The ratio of IFNγ production between NKG2A+ and NKG2A- NK cells is shown in the bar graphs. (A) Representative dot plots of NK cell IFNγ production upon stimulation with CHO cells expressing vector, pQa-1, or Qa-1 in the presence of Qdm-k peptide (AMVPRTLLL). (B) Splenocytes were co-cultured with indicated CHO cells in the presence of Qdm-k or control peptide. (C) Co-cultures were performed as in (B) in the presence of isotype or 20D5 (anti-NKG2A/C/E) antibody. (D) IFNγ and (E) CD107a expression by NK cells in response to CHO cells expressing pQa-1 single chain trimer (pQa-1-SCT) was performed as in (C). (F) Same experiment as in (D) and (E) was conducted after CHO-pQa-1-SCT and CHO-V cells were treated with or without 0.5 U/ml PI-PLC. (A–F) Representative experiments are shown from two to three independent experiments per panel. Bars in the figures represent mean ±SEM of duplicates. (G) 5000 Qa-1-restricted Ln12 T cells were co-cultured overnight with titrating amounts of human T2 cells (TAP-deficient cells) expressing vector, Qa-1, or pQa-1. The amount of IFNγ in the supernatants was determined by ELISA. EC7.1-Qa-1, a mouse TAP- and MHC-Ia-deficient lymphoma cell line transduced to express Qa-1 served as a positive control. Mean ±SD of triplicates is shown. (H) Lung metastasis formation 14 days after intravenous injection B16F10 melanoma cells expressing pQa-dtSCT or vector control (B16-pQa-1 or B16-V). Dots over each bar represent individual mice, cumulative data from two independent experiments. Two-tailed unpaired t test was used (*=p < 0.05; **=p < 0.01).


