. 2018 Dec 21;7:e41841. doi: 10.7554/eLife.41841

Figure 1. Rapid developmental transition in M1 sensory responsiveness.

(a) The method used to record electrophysiologically from a head-fixed pup. Dots denote locations of the EMGs (forelimb, red; hindlimb, green; nuchal muscle, blue). (b) Top: Flattened cortex sectioned tangentially to the surface and stained for cytochrome oxidase (CO); primary somatosensory cortex (S1) appears darker than the surrounding tissue. Bottom: Boundaries of primary sensory areas from CO-stained tissue, illustrating S1 and primary motor cortex (M1), as well as primary auditory (A1) and visual (V1) cortex. (c) Enlargement of gray box in (b) showing the somatotopic organization within S1 and M1. hl: hindlimb. (d) Enlargement of gray box in (c) showing the locations of recording sites (blue bars) within the forelimb representation of M1. (e) Left: Representative data at P8 depicting 20 s periods of active sleep (blue) and wake (red), showing forelimb movements (twitches: blue ticks; wake movements: red ticks), unit activity within the forelimb representation of M1, and rectified EMGs from contralateral forelimb and nuchal muscles. Each row of depicts unit activity for a different neuron. The bottom-most neuron (blue or red), is represented further at right. Right, top: Raster sweeps for an individual M1 neuron triggered on twitches (blue) and wake movements (red), with each row representing a different movement. Right, bottom: Perievent histograms (bin size = 10 ms) showing the unit’s mean firing rate triggered on twitches (blue) or wake movements (red). (f) Same as in (e) except at P11. (g) Same as in (e) except at P12.

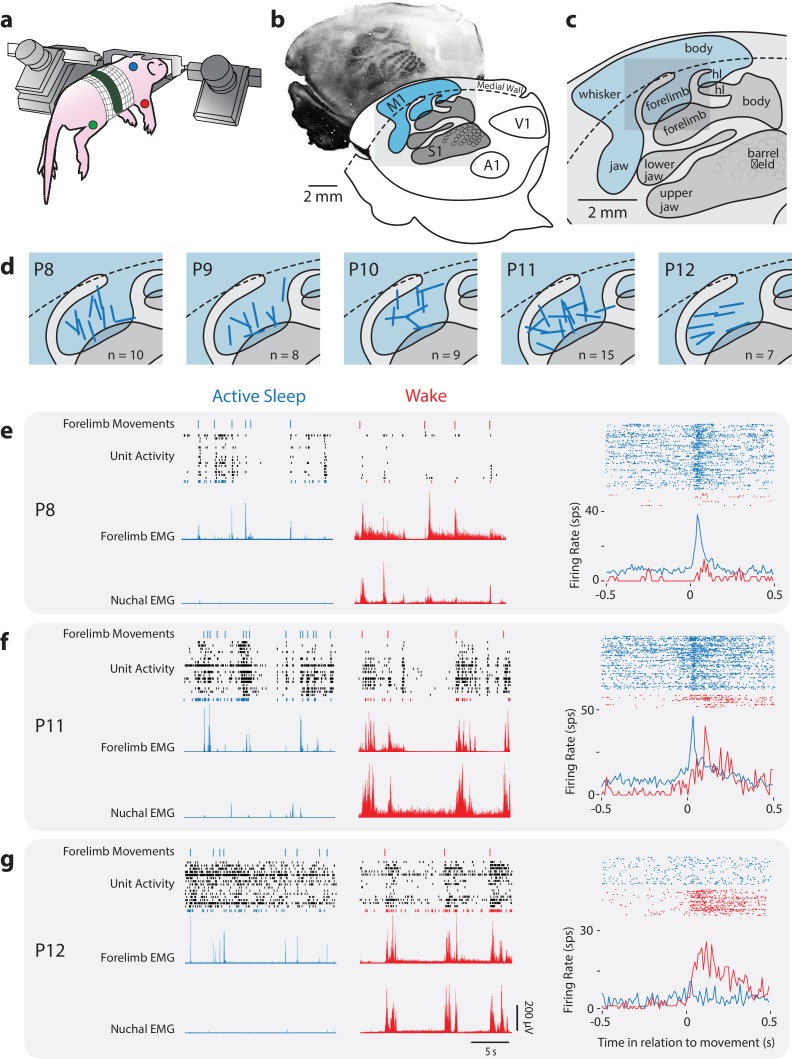
Figure 1.

Figure 1—figure supplement 1. M1 recording locations in coronal perspective.

Figure 1—figure supplement 1.

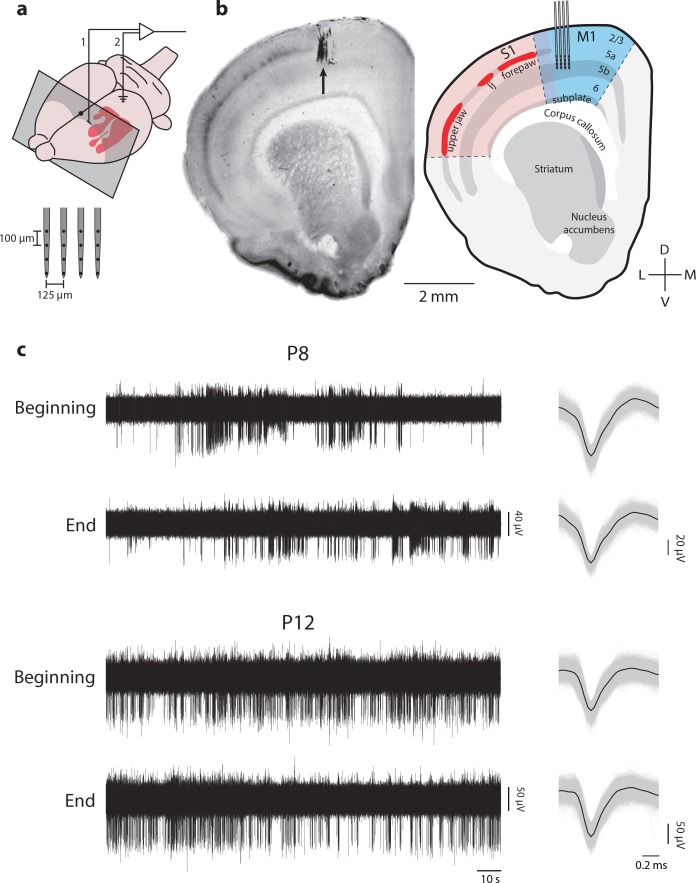
(a) Upper: Illustration of an infant rat brain showing the location of primary somatosensory cortex (S1; red), the recording location in the forelimb representation of M1 (1), and the location of the ground electrode in occipital cortex (2). Grey box shows the rostrocaudal location of the coronal sections in (b). Lower: Diagram of the 4-shank electrode used for M1 recordings. (b) Left: Coronal section stained for CO showing the electrode location (black arrow). Right: Illustration of the somatotopic representations in S1 and the laminar structures of S1 and M1. Recordings with shank electrodes were performed at a depth of 700–1200 µm, with the recording sites targeted at layer 5. lj: lower jaw. (c) Left: Representative raw MUA trace at the beginning (first 120 s) and end (last 120 s) of data collection for a P8 (top) and P12 (bottom) rat. Right: Mean waveform (black line) overlaid on all individual waveforms for the records shown at left.

Figure 1—figure supplement 2. Frequency and kinematics of twitches and wake movements across age.

Figure 1—figure supplement 2.

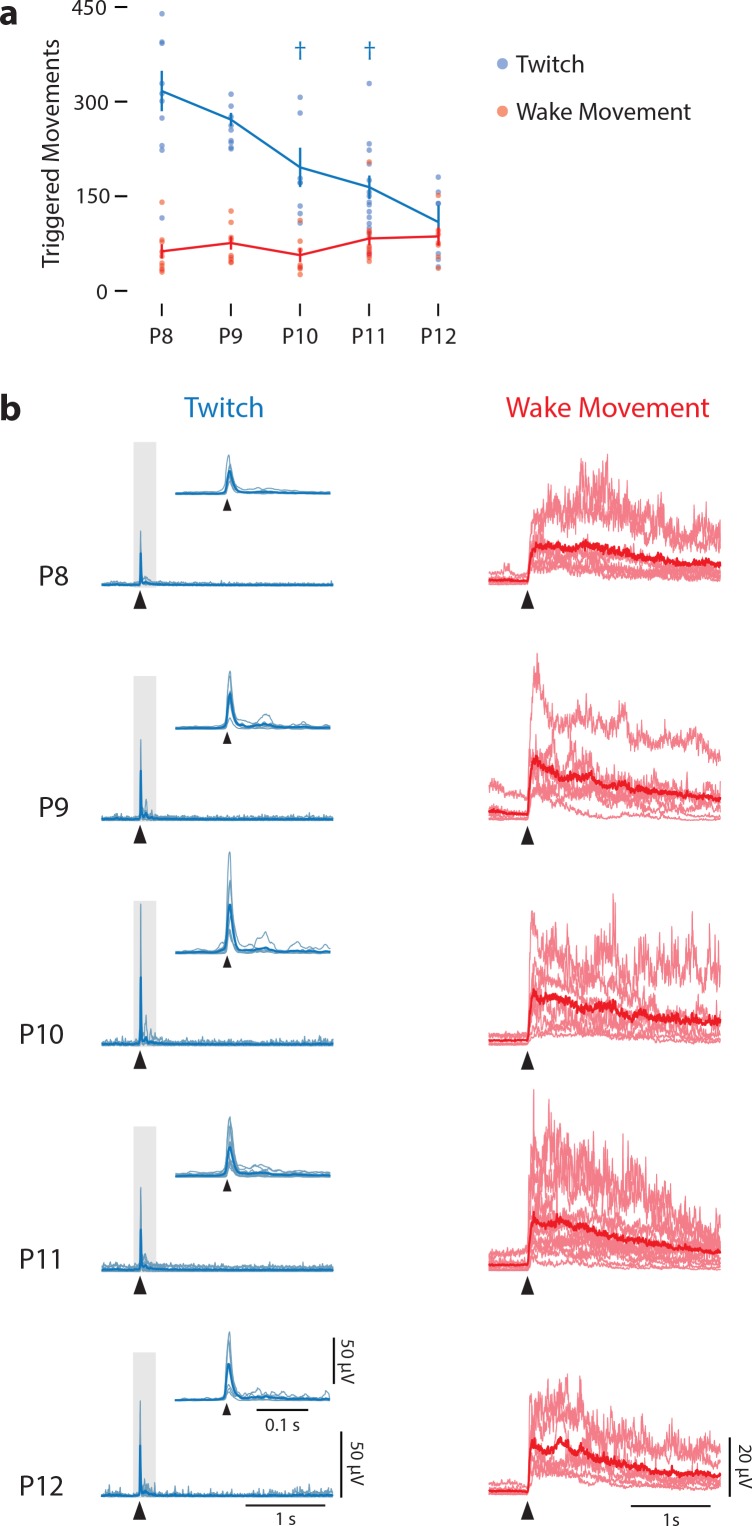
(a) Mean (±SEM) number of triggered twitches (blue) and wake movements (red) across all pups over 30 min of recording at each age. Dots indicate values for each individual pup. There was no effect of age on the number of wake movements, but there was for twitches. † Significant difference from two days prior (p<0.005). (b) Mean rectified EMGs for twitch (light-blue lines) and wake movements (light-red lines) for each pup at each age. Heavy blue and red lines represent median values. Arrowheads denote movement onset. For EMG records of twitches, insets are enlargements of the data in the gray rectangles.