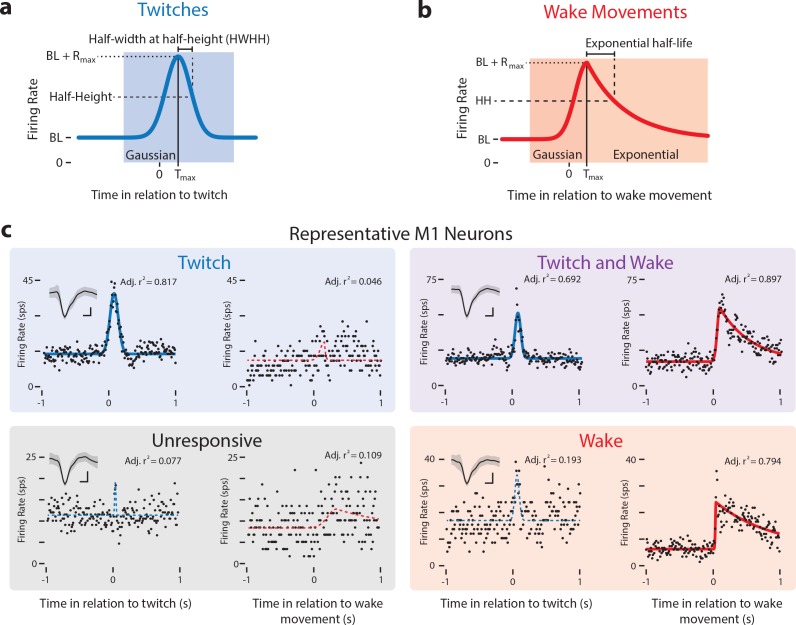
Figure 2. Modeling reafferent responses of M1 neurons to twitches and wake movements.
(a) Gaussian function used to model M1 neural responses to twitches. Based on the model fits for twitch-triggered perievent histograms, we derived estimates of each neuron’s baseline firing rate (BL), maximum response (Rmax), peak time (Tmax), and half-width at half-height (HWHH). (b) Gaussian-exponential function used to model M1 neural responses to wake movements. The function’s rising phase is a Gaussian function, identical to that in (a). The falling phase is an exponential decay function. Parameters defined as in (a). (c) Representative perievent histograms and model fits illustrating all four neuron classifications: Twitch-responsive, unresponsive, twitch- and wake-responsive, and wake-responsive. Also shown is each neuron’s Gaussian fit (blue lines) and Gaussian-exponential fit (red lines). Fits with adjusted r2 values less than 0.35 are shown with a dotted line and fits with an adjusted r2 value greater than 0.35 are shown with a solid line. Inset in the top left corner of is each neuron’s mean waveform (black line) ±standard deviation. Vertical scale bar = 20 μV, Horizontal scale bar = 0.2 ms.

