. 2018 Dec 12;7:e41771. doi: 10.7554/eLife.41771

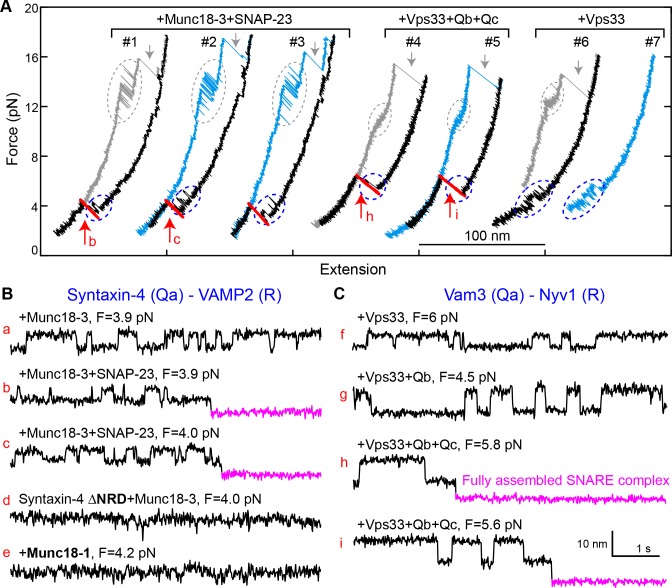
Figure 10. Munc18-3 and Vps33 catalyze SNARE assembly via template complexes.

(A) FECs of the Munc18-3 or Vps33 cognate Qa-R SNARE conjugate in the presence of the indicated protein(s). See also Figure 10—source datas 1 and 2. (B–C) Extension-time trajectories at the indicated constant mean forces, some of which (b, c, h, and i) are extracted from panel A. See also Figure 10—source datas 3 and 4.

Figure 10—source data 1. MATLAB figure corresponding to Figure 10A (FECs #1–3).
DOI: 10.7554/eLife.41771.046
Figure 10—source data 2. MATLAB figure corresponding to Figure 10A (FECs #4–7).
DOI: 10.7554/eLife.41771.047
Figure 10—source data 3. MATLAB figure corresponding to Figure 10B (traces a-e).
DOI: 10.7554/eLife.41771.048
Figure 10—source data 4. MATLAB figure corresponding to Figure 10C (traces g-i).
DOI: 10.7554/eLife.41771.049

Figure 10.

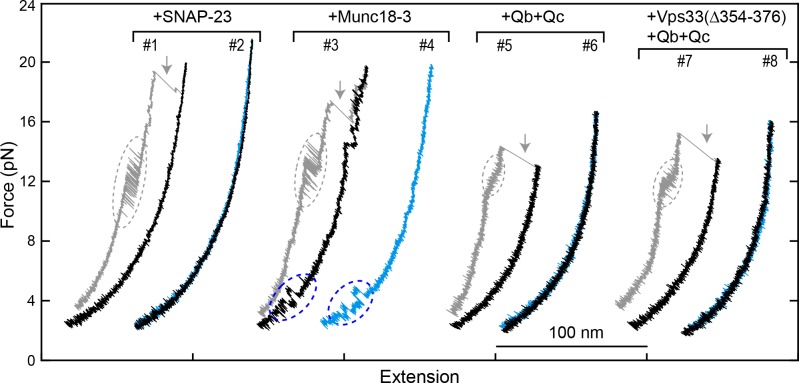
Figure 10—figure supplement 1. FECs obtained by pulling and relaxing a single syntaxin-4-VAMP2 conjugate (#1–4) or Vam3-Nyv1 conjugate (#5–8) in the presence of the indicated protein or proteins.

Figure 10—figure supplement 1.

SNARE CTD transitions and template complex transitions are marked by gray and blue ovals, respectively. Gray arrows indicate SNARE unzipping. Vps33(Δ354–376) is analogous to Munc18-1 Δ324–339 and is inactive in vivo and in vitro (Baker et al., 2015).
Figure 10—figure supplement 2. FECs displaying Vps33-catalyzed vacuolar SNARE assembly, marked by red arrows.
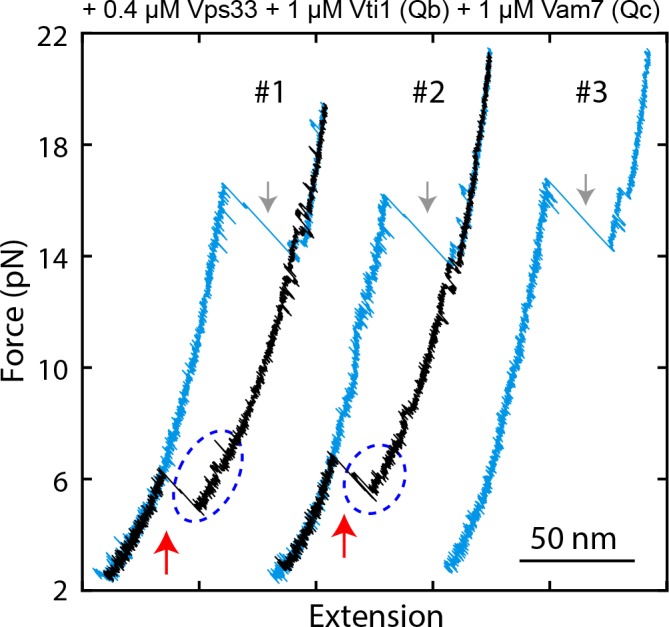
Figure 10—figure supplement 2.

Gray arrows indicate SNARE unzipping. Template complex transitions are marked by blue ovals.
Figure 10—figure supplement 3. Probabilities of vacuolar SNARE assembly per relaxation under different conditions.
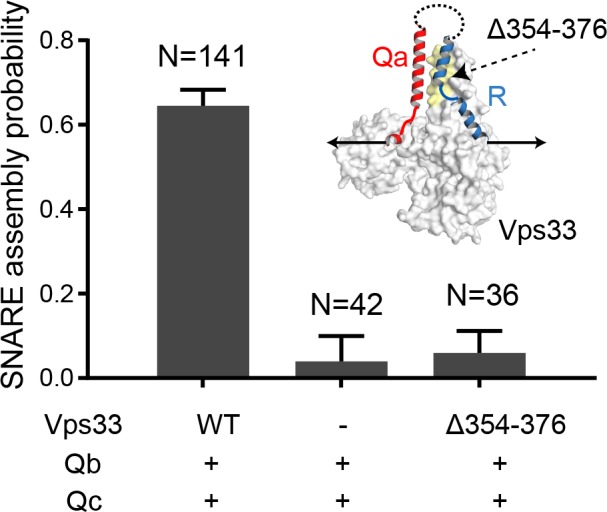
Figure 10—figure supplement 3.

The insert shows the pulling direction and the region of the Vps33 truncation (yellow).