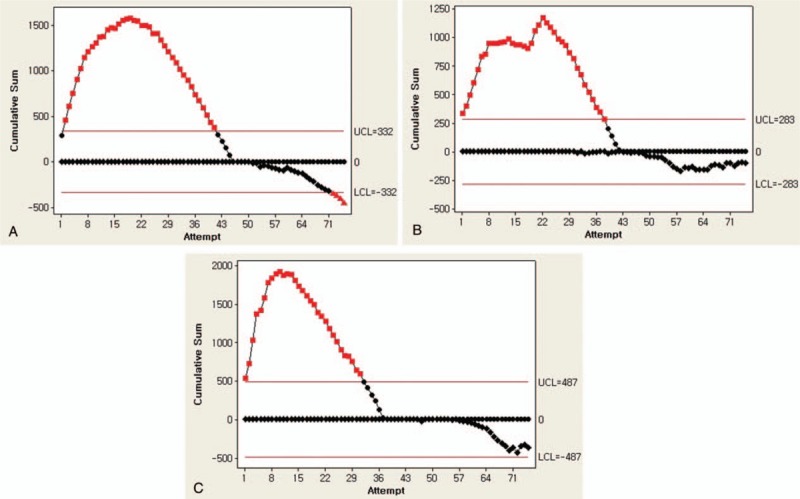
Figure 2.

Learning curves of the proctoring group (A), video only group (B), and independent group (C) depicted by the cumulative sum chart. LCL = lower cumulative limit, UCL = upper cumulative limit.

Learning curves of the proctoring group (A), video only group (B), and independent group (C) depicted by the cumulative sum chart. LCL = lower cumulative limit, UCL = upper cumulative limit.