Figure 3.

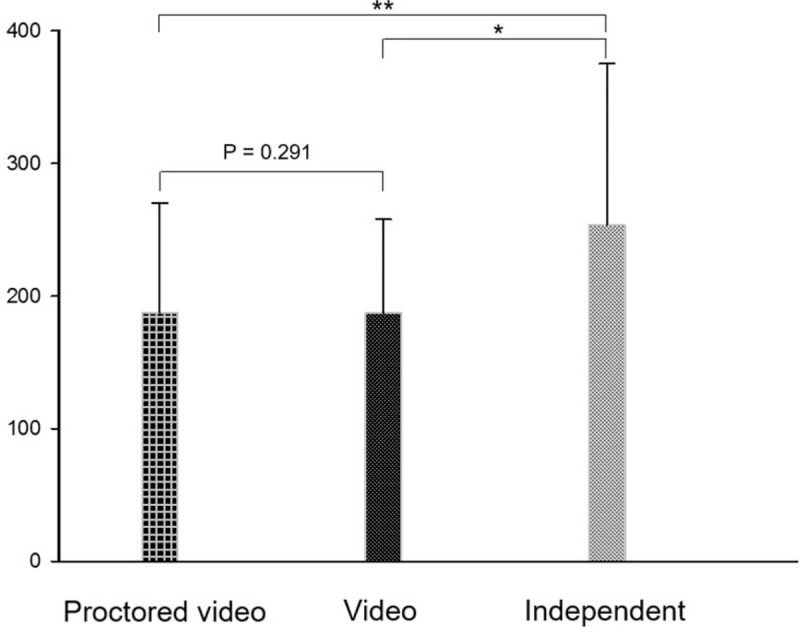
Comparisons of the mean time differences for completing the task among the 3 groups after overcoming learning curve. ∗, ∗∗: statistically significant (P < .05) between the 2 groups.

Comparisons of the mean time differences for completing the task among the 3 groups after overcoming learning curve. ∗, ∗∗: statistically significant (P < .05) between the 2 groups.