Figure 1.

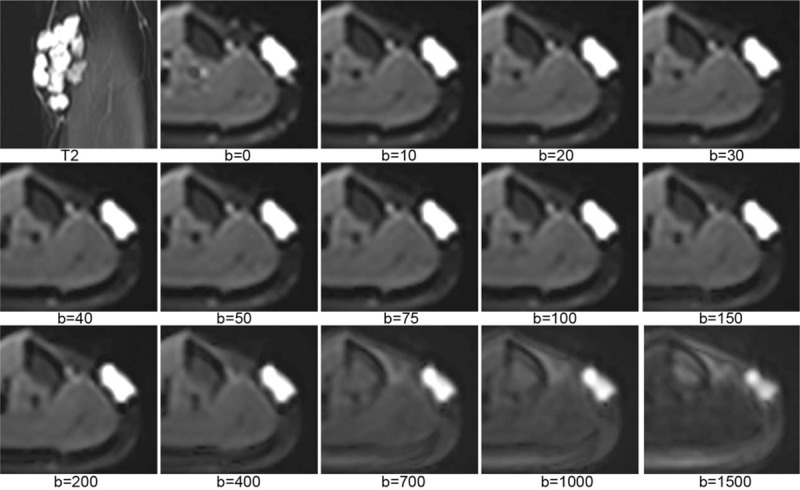
The first image (saggital FSE T2) displayed a vascular anomaly at left calf. The others were intravoxel incoherent motion images with b values from 0 to 1500 s/mm2. As b value increased, signal intensity of the lesion decreased.

The first image (saggital FSE T2) displayed a vascular anomaly at left calf. The others were intravoxel incoherent motion images with b values from 0 to 1500 s/mm2. As b value increased, signal intensity of the lesion decreased.