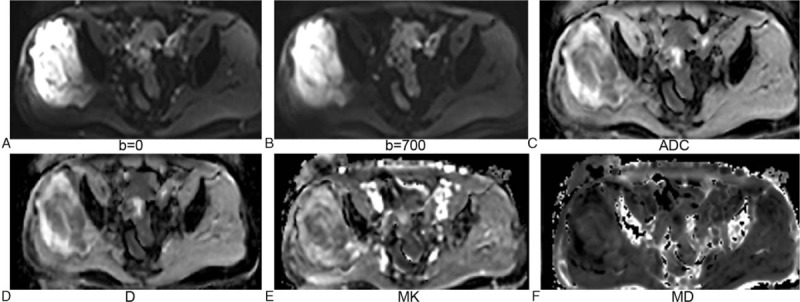
Figure 3.

A fibrosarcoma at right hip was well displayed on b = 0 map (A) and b = 700 s/mm2 map (B). Apparent diffusion coefficient map (C) and D map (D) were generated with intravoxel incoherent motion model. Mean kurtosis map (E) and mean diffusion map (F) were generated with diffusion kurtosis imaging model.
