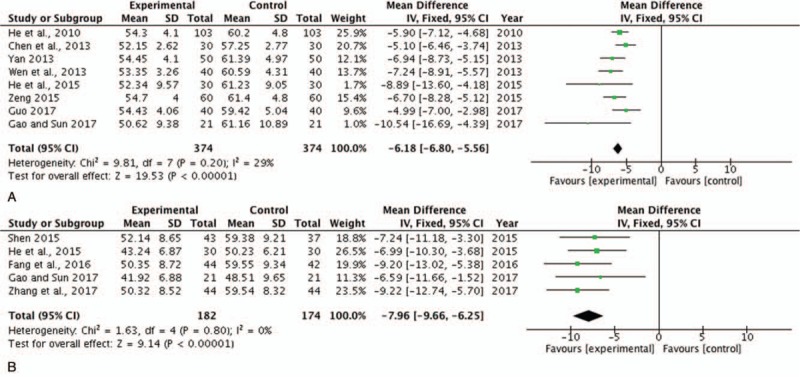
Figure 6.

Forest plot of LVEDD and LVESD comparing the experimental and control groups. (A) Forest plot of LVEDD; (B) forest plot of LVESD. P and I2 are the criteria for the heterogeneity test. ♦ pooled mean difference, –▪– mean difference and 95% CI. LVEDD = left ventricular end-diastolic diameter, LVESD = left ventricular end-systolic diameter.
