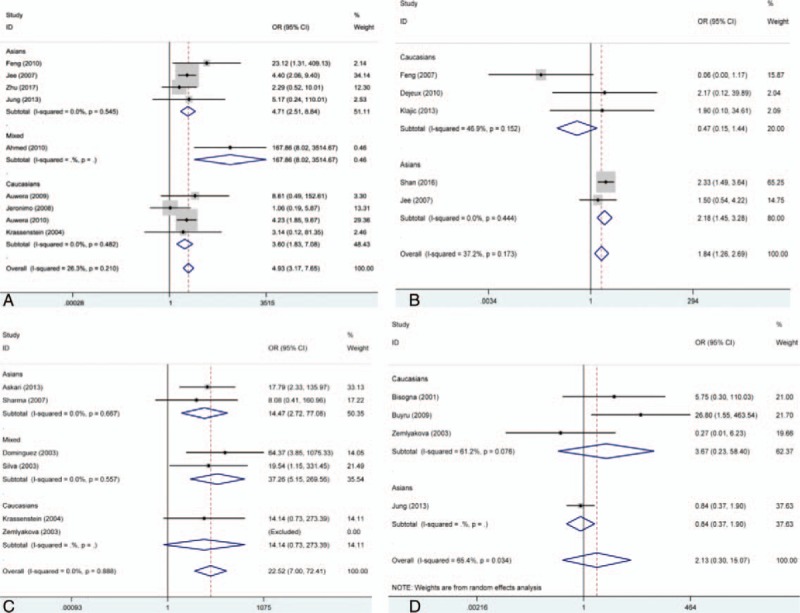
Figure 5.

Forest plot for associations of DAPK, hMLH1, p14, and p15 promoter hypermethylation with risk of breast cancer. (A) Forest plot for DAPK; (B) forest plot for hMLH1; (C) forest plot for p14; (D) forest plot for p15. CI = confidence intervals, OR = odds ratio.
