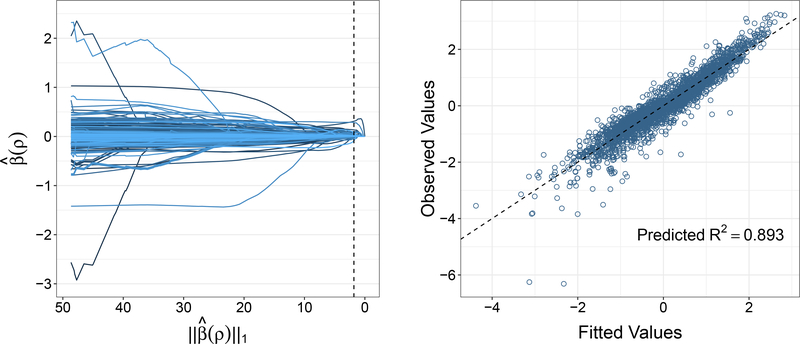
Figure 4:
Path algorithm yields the constrained lasso solution path for the Ames housing data with 48 factors. The dashed line marks the model with the lowest BIC (left panel) as well as the identity line (right panel). Here the response is the log-transformed sale price that is standardized to have mean 0 and standard deviation 1.

