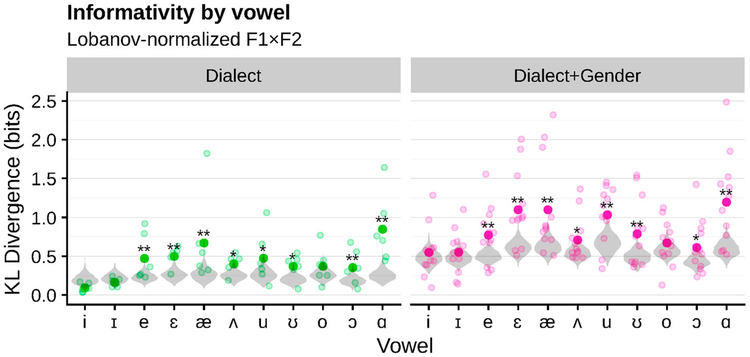
Figure 4.
Individual vowels vary substantially in the informativity of grouping variables about their cue distributions. Only normalised F1×F2 is shown to emphasise dialect effects. Large dots show the average over dialects (+genders), while the small dots show individual dialects (+genders) (see Figure 5 for detailed breakdown of individual dialect effects). The grey violins show the vowel-specific null distributions of the averages, estimated based on 1000 datasets with randomly permuted group labels, and stars show permutation test p value (proportion of random permutations with the same or larger KL divergence), with false discovery rate correction for multiple comparisons (Benjamini & Hochberg, 1995).

