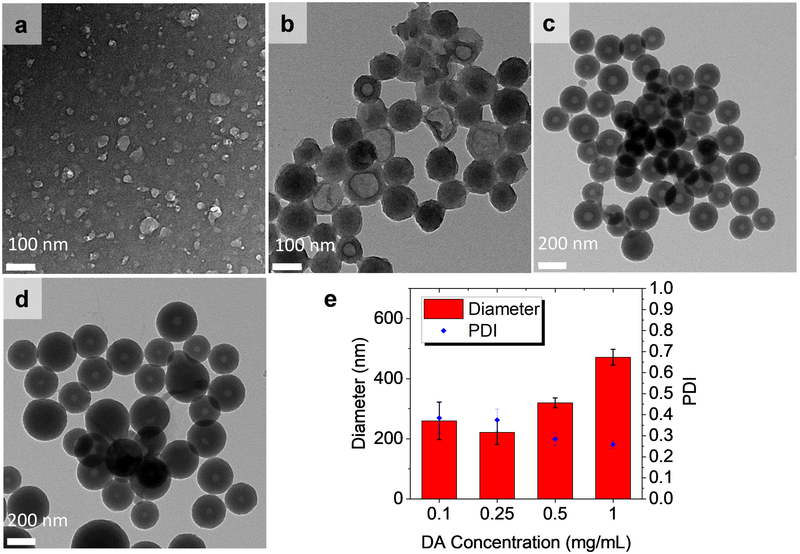
Figure 7:
Effect of DA concentration on RV@PDA grown in 0.25 mg/mL RV solution. (a-d) TEM images of RV@PDA grown with (a) 0.10, (b) 0.25, (c) 0.50, and (d) 1.00 mg/mL DA. TEM grids for (b-e) were prepared from purified nanostructures, and the TEM grid for (a) was prepared directly from growth solution after 24 h. (e) Hydrodynamic diameters and PDI of RV@PDA prepared with 0.10—1.00 mg/mL DA and 0.25 mg/mL RV measured by DLS. Error bars represent ± 1 SD of 3 independently prepared batches of RV@PDA. Data for DLS obtained from RV@PDA purified via centrifugation for 0.25 mg/mL—1.00 mg/mL DA and from growth solutions directly at 0.10 mg/mL DA after 24 h.

