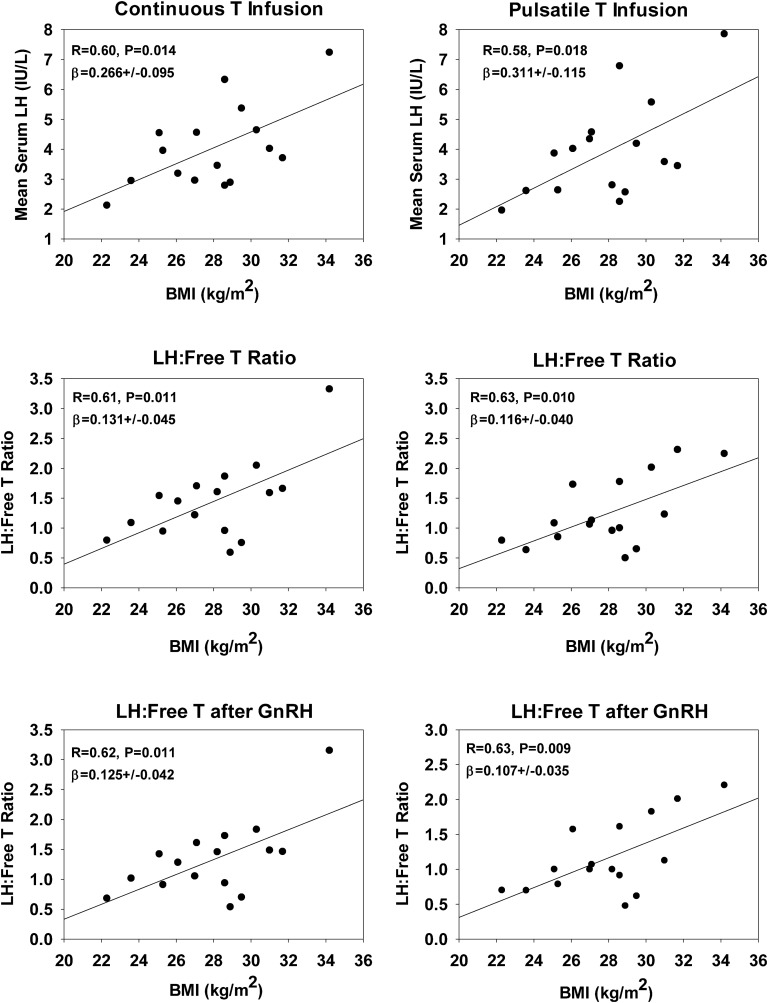
Figure 5.
Linear regressions of mean LH concentrations (before and after GnRH injection) and LH/free T ratios (y-axes) under controlled T feedback on BMI (x-axes). The ratios were calculated from the mean concentrations of LH and free T during the periods from 09:00 to 16:30 and after GnRH injection.

