
Extended Data Fig. 7 |. The differentiation state of CAR T cells in Patient-10 compared to other responders over time.
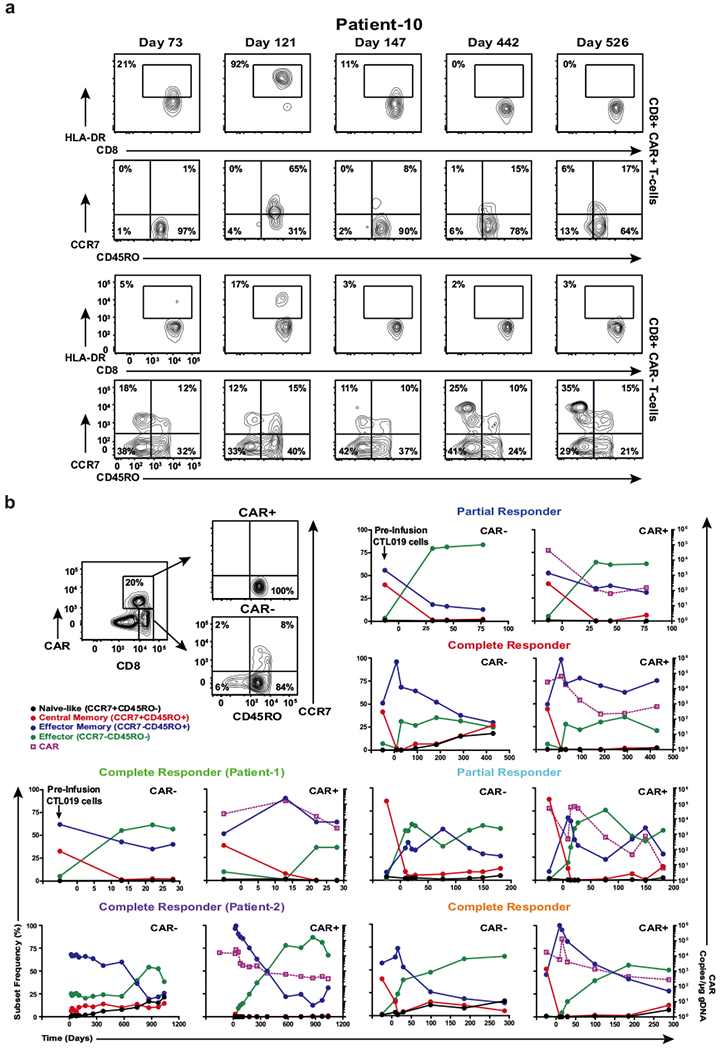
a, Representative contour plots of flow cytometric data depicting the frequency of CAR+ and CAR−CD8+ T cells in Patient-10 that express HLA-DR. The proportions of these cells that express CD45RO and CCR7 as determinants of differentiation status are shown. Contour plot insets indicate the frequencies of the gated cell populations. b, Example gating strategy used to determine the differentiation phenotype of CD8+CAR+ and CAR− T cells from a complete responder (top left). Line graphs depict the differentiation state of these cell populations in other responding patients over time and are plotted with corresponding CAR T cell levels in the blood, as determined by qPCR.