
Extended Data Fig. 8 |. Effect of TET2 expression on T cell differentiation and viability.
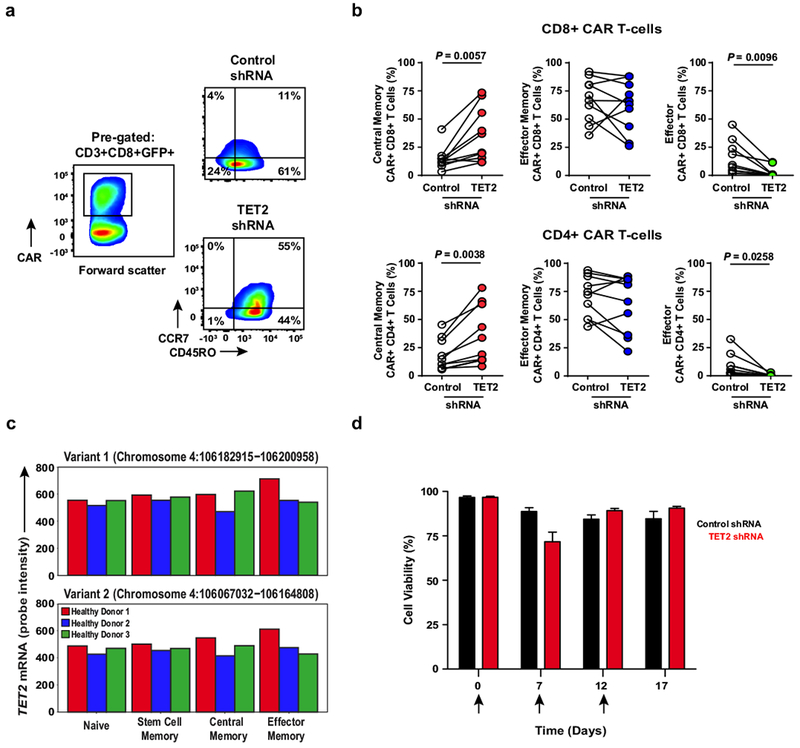
a, Representative flow cytometry plots showing the differentiation state of healthy donor CD8+CAR+ T cells after transduction with a scrambled shRNA (control) or shRNA targeting TET2. Insets define frequencies of gated populations. b, Frequencies of healthy subject CAR+CD8+ (top) and CAR+CD4+ (bottom) T cells according to differentiation phenotype following control or TET2 shRNA transduction (n = 10; pooled results from four independent experiments). P values were determined using a two-tailed, paired Student’s t-test. c, Comparison of the expression levels of TET2 in naive and memory CD8+ T cell subsets from three healthy donors. Two variants encoding different isoforms have been identified for this gene in humans. Expression levels of each TET2 variant were estimated by measuring the probe intensity from microarray analysis. d, Viability of CAR+ T cells transduced with a TET2 shRNA or scrambled control and restimulated with K562 cells expressing CD19 (n = 12; pooled results from three independent experiments). Each arrow indicates the time point at which CAR T cells were exposed to antigen. Error bars depict s.e.m.